
The worksheet below is aimed towards helping elementary school students uses graphs to learn about the different continents and the population density of each continent (printable version of this lesson about continents and population).
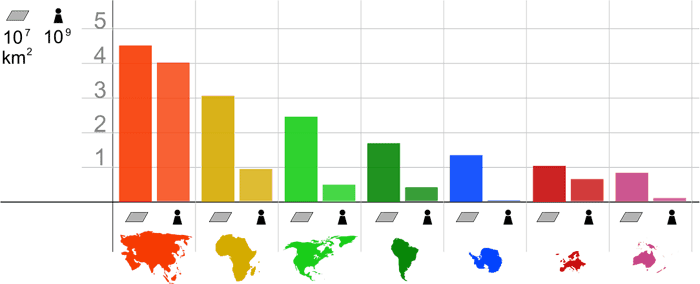
The chart below shows the size and population of each continent and should be used to answer the following question.
First, name the seven continents of this graph.
Next, answer the following questions about population and area:
a. What is the most populated continent?
b. What is the least populated continent?
c. What is the continent which has the largest area?
d. What is the continent that has the smallest area?

Calculating population density
The human population density is the number of people per unit area. The human population density is often expressed in people per a specific geographic area and is simply obtained by dividing the number of people considered by the surface measured in square kilometers or square miles.
Finish the table below to calculate population density per square mile for each of the continents. The answer table is at the end of this page.
Which continent has the highest population density? Which continent has the lowest population density.
| Continent | Area (km²) | Area (mi²) | 2010 Population | Population Density (per km²) |
|---|---|---|---|---|
| Asia | 43,820,000 | 16,920,000 | 4,164,252,000 | |
| Africa | 30,370,000 | 11,730,000 | 1,022,234,000 | |
| North America | 24,490,000 | 9,460,000 | 542,056,000 | |
| South America | 17,840,000 | 6,890,000 | 392,555,000 | |
| Antarctica | 13,720,000 | 5,300,000 | 0* | |
| Europe | 10,180,000 | 3,930,000 | 738,199,000 | |
| Australia | 9,008,500 | 3,478,200 | 29,127,000 |
Table of Population Data by Continent
| Continent | Area (km²) | Area (mi²) | Percent of World Landmass | 2010 Population | Percent of Total World Population | Population Density (per mi²) |
|---|---|---|---|---|---|---|
| Asia | 43,820,000 | 16,920,000 | 29.50% | 4,164,252,000 | 60% | 246 |
| Africa | 30,370,000 | 11,730,000 | 20.40% | 1,022,234,000 | 15% | 87 |
| North America | 24,490,000 | 9,460,000 | 16.50% | 542,056,000 | 8% | 57 |
| South America | 17,840,000 | 6,890,000 | 12.00% | 392,555,000 | 6% | 57 |
| Antarctica | 13,720,000 | 5,300,000 | 9.20% | 0* | 0% | 0.00078 |
| Europe | 10,180,000 | 3,930,000 | 6.80% | 738,199,000 | 11% | 188 |
| Australia | 9,008,500 | 3,478,200 | 5.90% | 29,127,000 | 0.40% | 8.3 |
The data used for this exercise is from: “Total Population – Both Sexes”. World Population Prospects, the 2010 Revision. United Nations Department of Economic and Social Affairs. 28 June 2011.
*While Antarctica has no permanent residents, a varying number (roughly 1,000 in the summer and 4,000 in the winter) of people inhabit field stations and research stations on a seasonal basis. Source: CIA World Factbook – Antarctica