
Maps and Cartography
Maps and cartography are essential tools in geography that enable us to visualize and understand the Earth’s surface and its features.
Cartography is the art and science of creating maps, which involves the use of sophisticated technology and techniques to accurately represent the Earth’s physical and cultural features.
Maps provide a visual representation of the world, allowing us to identify patterns, explore spatial relationships, and navigate through unfamiliar terrain.

Cartopareidolia: Seeing People and Animals in Maps
Cartopareidolia is the tendency to see familiar shapes, animals, faces, and objects in coastlines, borders, and maps.

Learn How to Read a Map
Map reading is the skill of interpreting and understanding the geographic details and information shown on a map.

Zoomorphic Maps: Imagining Maps as Animals
These zoomorphic maps were designed as propaganda tools, with each one depicting the world in a way that reflected the message the cartographer intended to convey.

Explore U.S. National Parks: Fun Map and Geography Trivia
This interactive map lets you browse interesting geographical facts and trivia about the 61 U.S. national parks.

What’s in a Map? Exploring the Elements of Cartography
Maps visualize geographic data, and contain elements like data frames, legends, titles, north arrows, scale bars, citations, borders, and inset maps.

What is at Zero Degrees Latitude and Zero Degrees Longitude?
What can be found at zero degrees latitude and zero degrees longitude?

Latitude and Longitude Explained: How to Read Geographic Coordinates
Learn more about lines you see on a map running east-west and north-south called latitude and longitude.

Cordiform: Heart-Shaped Map Projections
Heart shaped map projections are known as cordiform map projections which is derived from the Latin "cor" for heart and form for shape.
How to Track Santa Claus in 2023
Learn about the history of tracking Santa's Christmas travels and how to follow Santa using NORAD's app.
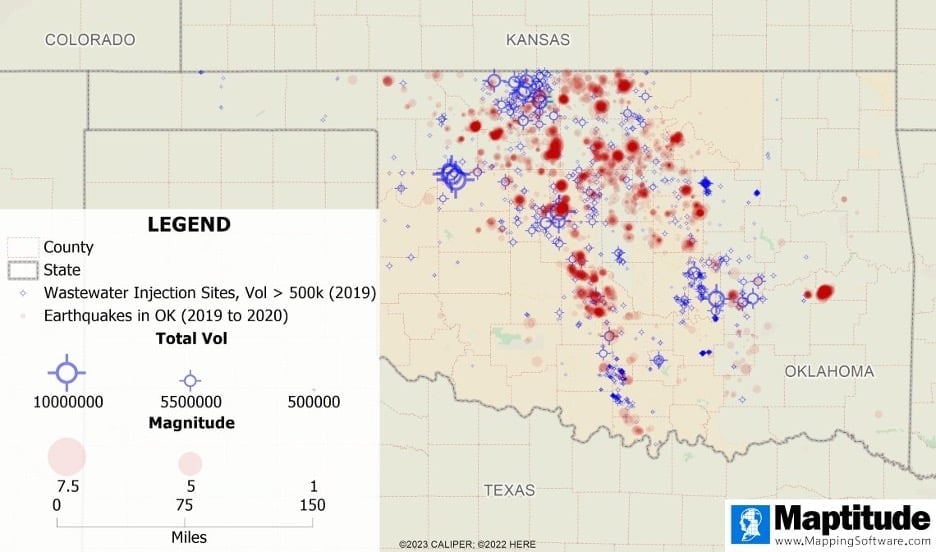
How Mapping Software Helps Us Analyze Earthquakes
Mapping software can help us observe trends in earthquakes, identify areas of high earthquake prevalence, and explore relationships between earthquakes and other phenomena.

What are Graduated Symbols in GIS?
Graduated symbols is one way of visualizing data that can be quantified on a map in GIS.

Mapping Building Heat Using Remote Sensing
Startup Satellite Vu launched the first of a satellite constellation to measure building heat signatures in high resolution.

Green View Index for QGIS
Green View Index is a QGIS plugin that uses street-level imagery to measure the amount of vegetation visible to the human eye.
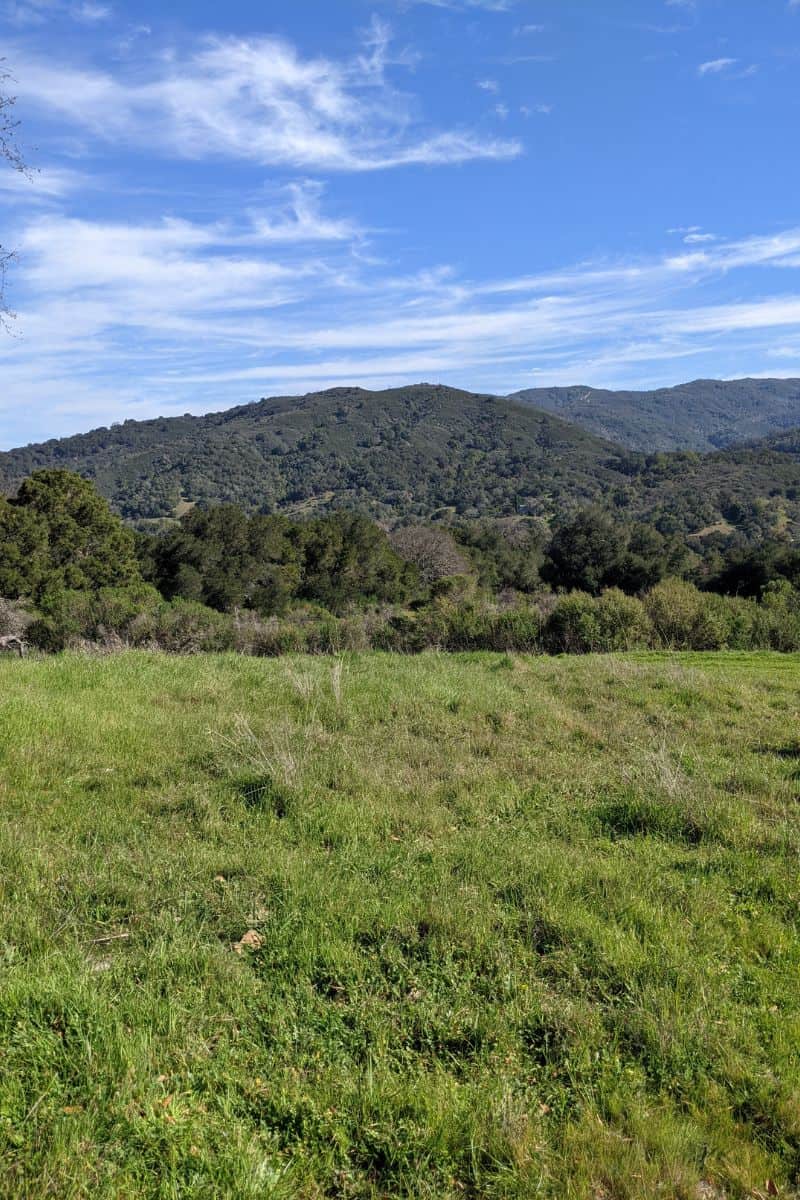
Using Open GIS Data to Map Public Urban Green Spaces
Satellite imagery like Sentinel-2 can help map green spaces. Using OpenStreetMap (OSM) can help to distinguish public and private green spaces.
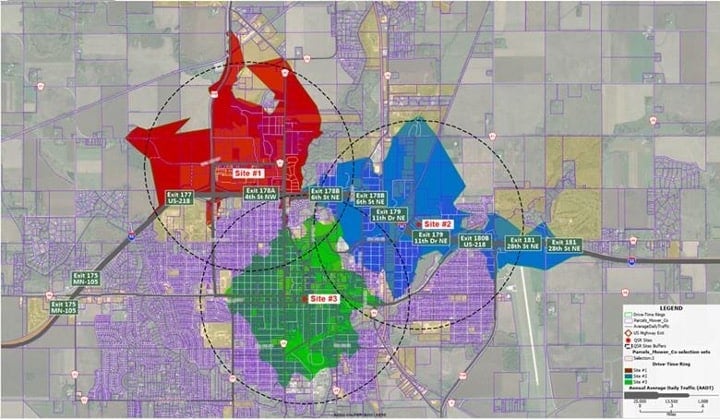
GIS for Local Government: Economic Development and Site Selection
This GIS tutorials shows how to use Maptitude in the municipal government sector for economic development and site selection.

Mapping Snowpack and Forecasting River Rise in California
Measuring snow and forecasting snowmelt effects on river rise is important for planning for California's water needs and to mitigate flooding.

GIS for Local Government: Public Works
This article by Stewart Barry and Brett Lucas describes an application of Maptitude in the municipal government sector for public works.

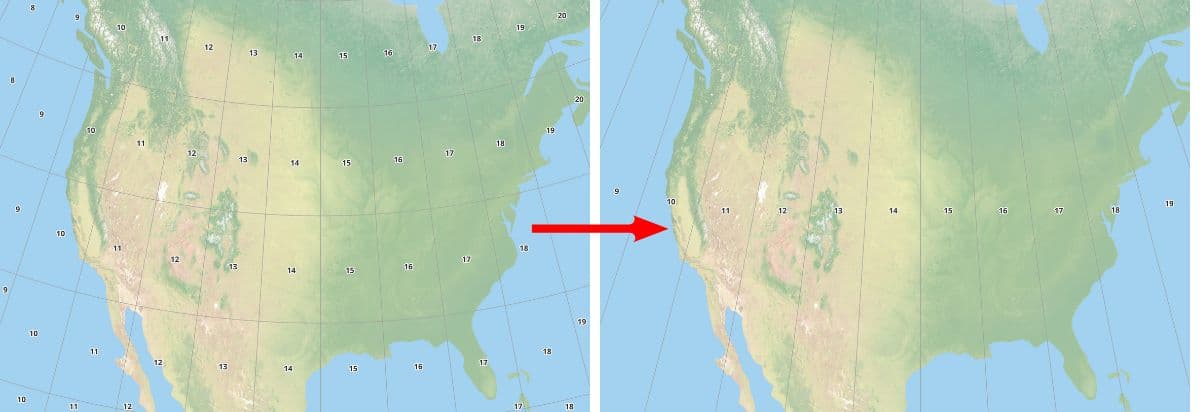
Types of Map Projections
Map projections are used to transform the Earth's three-dimensional surface into a two-dimensional representation.
Dissolve Features Based on Attribute in QGIS
This GIS tutorial provides a step-by-step guide on how to dissolve features in QGIS based on an attribute field.

GIS for Local Government: Public Safety
This GIS tutorial from Maptitude shows users how to map out crime and demographics.

United States Cropland Data
The Cropland Data Layer (CDL) is a GIS dataset that the USDA updates annually to map the crops grown across the United States.

GIS for Local Government With Maptitude: Planning and Zoning
This article explores how to use GIS in local or Municipal Government using Maptitude.

How to Create an Air Pollution Map Using ArcGIS Pro
This GIS tutorial outlines how to use ArcGIS Pro to map air pollution using data from the United States Environmental Protection Agency.

Universal Transverse Mercator (UTM) Coordinate System
UTM is a precise, grid-based coordinate system ideal for regional mapping and navigation, utilizing 60 zones to minimize distortion.

Mapping Social Vulnerability to Natural Hazards
Geospatial technology can be used to map social vulnerability to natural hazards, aiding in disaster planning and response.

New Techniques for Measuring Biodiversity With Remote Sensing
New satellite imagery techniques make it easier to observe plant biodiversity and map changes over time, allowing conservationists to plan for the future.