Author: Max Bahar
Earthquakes impact our lives in a multitude of ways. In 2010, 226,050 deaths around the world were attributed to seismic activity.1 In the United States alone, earthquakes are estimated to be responsible for losses of $6.1 billion each year.2 Using mapping software to examine earthquakes has become paramount in understanding and analyzing these events.
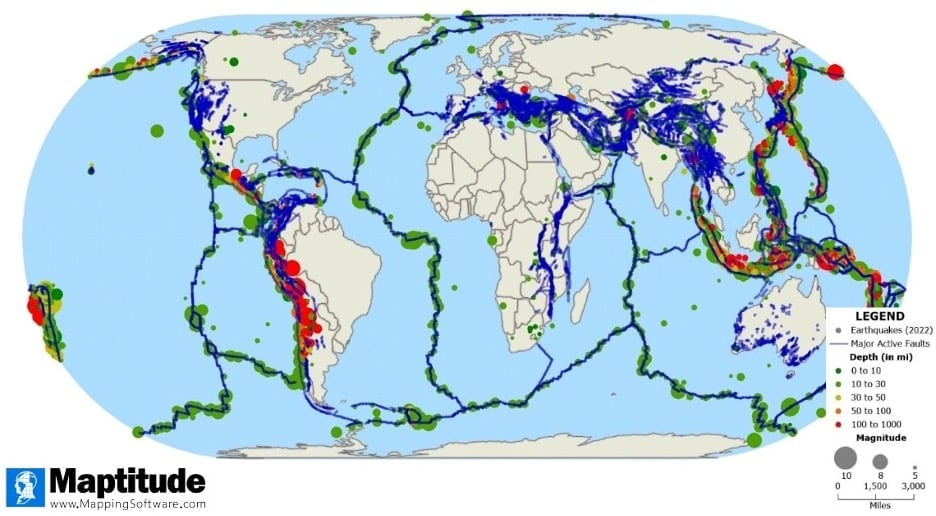
World map of earthquakes in 2022
With mapping software, we can visualize trends and observe where earthquakes are most prevalent. With data from the United States Geological Survey (USGS), we can plot all the earthquakes in 2022 with a magnitude of 4.5 or greater. We can see that most earthquakes happen relatively close to the surface (around 0 to 30 miles deep) though deeper earthquakes occur in Southeast Asia and South America.
Furthermore, plotting the earthquakes reveals that they form lines on the map. These trend lines are not coincidence; they are fault lines. Earthquakes occur when there is a sudden slip on a tectonic plate fault.3 Adding major fault lines to the map confirms this relationship, most of the earthquakes in 2022 with a magnitude of 4.5 and above occurred near a major fault line.

Map of earthquakes in the United States in 2022
We can use overlays in mapping software to aggregate earthquake data in specific areas. In the map below, we can see the prevalence of earthquakes in each of the mainland US states.

We can see that are many more earthquakes on the West coast than the East coast. This makes sense, as there are many active faults in the Western half of the US. The top states in terms of earthquake frequency are California ( 37,780 earthquakes) and Nevada (5,608).
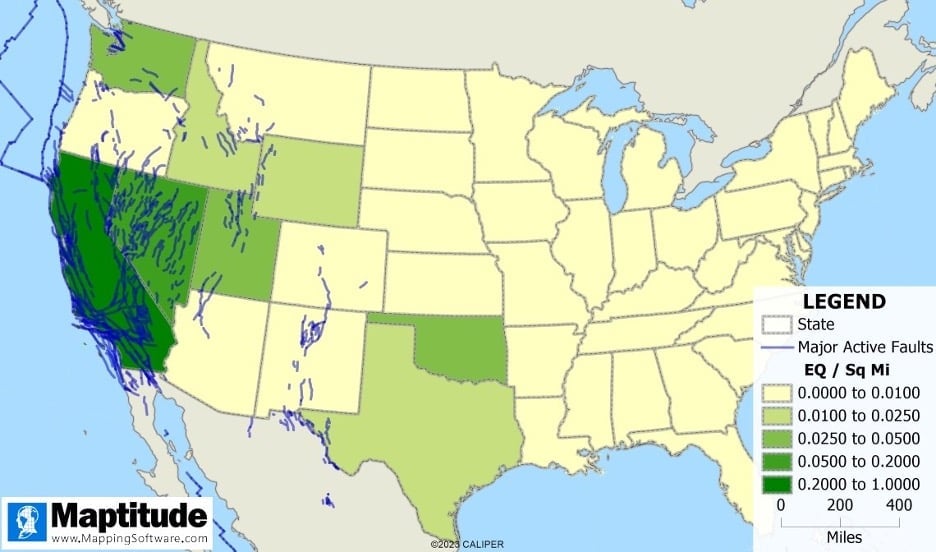
Map showing the density of earthquakes in the United States in 2022
However, it is possible that the prevalence of earthquakes can be attributed to the larger sizes of the Western states. For better comparison of earthquake prevalence across states, we can calculate the number of earthquakes per square mile for each state.

After taking the size of the states into account, we see that some of the Western states have a similar rate of earthquake prevalence as the Eastern states. Oregon has around 0.004 earthquakes per square mile, which is close to South Carolina who has 0.003 earthquakes per square mile. California and Nevada still lead the country in terms of number of earthquakes per square mile, with 0.24 earthquakes per square mile and 0.05 earthquakes per square mile respectively.
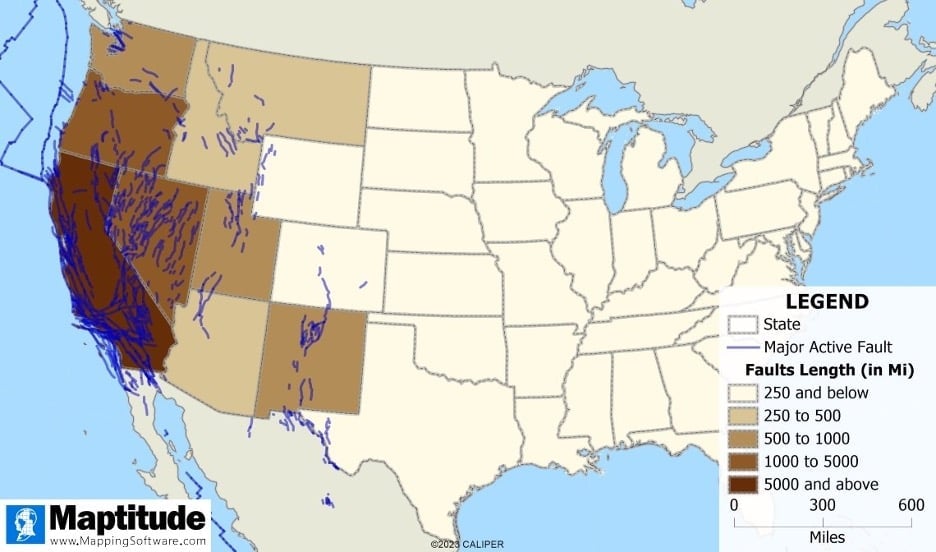
Map of fault lines in the United States
To further our understanding of earthquakes in the US, we can also look at the total number of miles of fault lines in each state. Unsurprisingly, California comes out on top again with 8,233 miles of faults. Second and third in the mainland US are Nevada and Oregon with 3,765 miles and 1,161 miles of faults respectively.

The maps that we’ve produced tell us that states with a larger number of faults are more likely to have a higher prevalence of earthquakes. However, despite their distance from the main active fault lines in the West, Texas and Oklahoma also have a high frequency of earthquakes in 2022. Texas had 2,902 earthquakes or 0.01 earthquakes per square mile and Oklahoma had 2,721 earthquakes or 0.04 earthquakes per square mile.
Human induced earthquake activity
Although earthquakes can be naturally more prevalent in certain areas, certain human actions can increase the risk of earthquakes. According to the USGS, the disposal of waste fluids that are a byproduct of oil production is the primary cause of the recent increase in earthquakes in the central United States.4
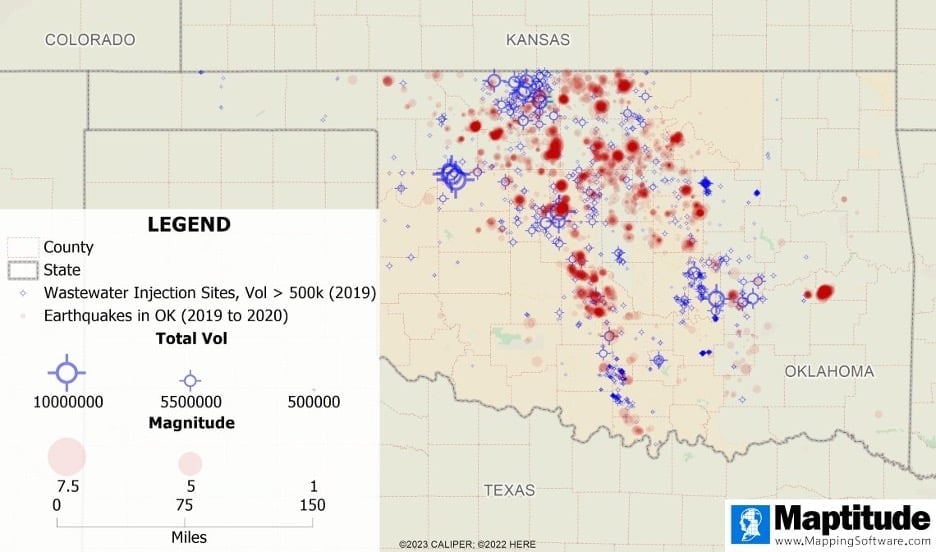
Earthquakes become more likely in areas where wastewater injection is prevalent because fluid pressures within the fault counteracts the frictional force on faults.5 To geographically analyze and explore this interaction, we can use 2019 data on wastewater injection sites from the Oklahoma Corporation Commission and 2019 to 2020 data on earthquakes in the state of Oklahoma from the USGS.

The map shows that there is some overlap of injection sites and earthquakes in Oklahoma. However, there are some areas in the state with many injection sites but no earthquakes. Not all injection sites contribute equally to seismic activity.
Sites that inject a higher volume of wastewater may contribute more to the pressure buildup in faults. Therefore, we can focus on injection sites that report high fluid injection volume by making use of selection sets. In the map below, we only show injection sites with total fluid volumes that exceeded 500,000 BBL in 2022. There, we see a much clearer correlation between the locations of injection sites and earthquakes.

In the resulting map, areas with sites injecting large amounts of wastewater are surrounded by earthquakes. There are some outliers, such as the cluster of earthquakes in the Eastern portion of the state, but these may be areas where naturally occurring earthquakes are common.
In conclusion, mapping software can help us observe trends in earthquakes, identify areas of high earthquake prevalence, and explore relationships between earthquakes and other phenomena. You can request a free 30-day trial of Maptitude to see firsthand how mapping software can be used to help us better understand and analyze earthquakes.
Footnotes
1 Basic earthquake counts for the World and United States. (2021). USGS.gov. https://www.usgs.gov/programs/earthquake-hazards/lists-maps-and-statistics
2 Jaiswal, K., Bausch, D., Rozelle, J., Holub, J., & McGowan, S. (2017). Hazus® estimated annualized earthquake losses for the United States (No. FEMA P-366). Federal Emergency Management Agency. https://www.fema.gov/sites/default/files/2020-07/fema_earthquakes_hazus-estimated-annualized-earthquake-losses-for-the-united-states_20170401.pdf
3 What is an earthquake and what causes them to happen? (n.d.). USGS.gov. https://www.usgs.gov/faqs/what-earthquake-and-what-causes-them-happen
4 Myths and misconceptions about induced earthquakes. (n.d.). USGS.gov. https://www.usgs.gov/programs/earthquake-hazards/myths-and-misconceptions-about-induced-earthquakes
5 How does the injection of fluid at depth cause earthquakes? (n.d.). USGS.gov. https://www.usgs.gov/faqs/how-does-injection-fluid-depth-cause-earthquakes
