
Maps and Cartography
Maps and cartography are essential tools in geography that enable us to visualize and understand the Earth’s surface and its features.
Cartography is the art and science of creating maps, which involves the use of sophisticated technology and techniques to accurately represent the Earth’s physical and cultural features.
Maps provide a visual representation of the world, allowing us to identify patterns, explore spatial relationships, and navigate through unfamiliar terrain.

Map of Global Temperatures Since 1880
NASA takes a look at global temperatures and has a short piece and animated map showing the global change in ...

Your Brain on Maps
What do some recent studies that look at the brain and navigation suggest? Read on to find out.
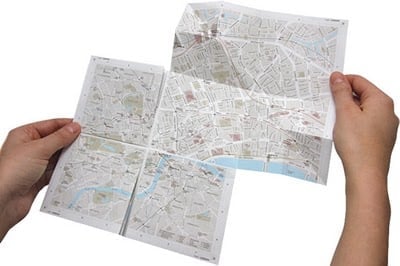
Zoomable Paper Map
Called map2, the uniqueness about this map of London is the patented folding technique that allows the viewer to either view a large scale map or to fold out sections to see the zoomed in area.
First Thematic Maps
Zachary Forest Johnson provides an overview on Indiemaps.com on the first published instances of each of the six most commonly ...

Online Mapping is Not the Death Knell for Maps
Despite fretting by some, the rise of online mapping is not end of cartography and map making as we know it.
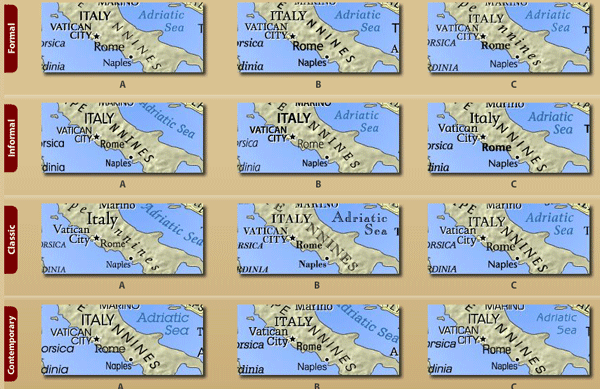
TypeBrewer – Font Tool for Cartography
TypeBrewer is a Flash application that “offers a quick and easy way to explore typographic alternatives and see the impact ...
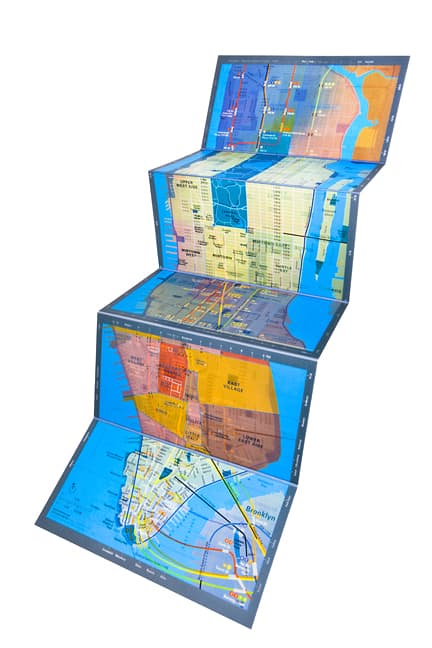
As Dynamic as Paper Maps Get
Panamap is a physical map that uses layered plastic sheets to display three distinct map views on a single page.
Crime Mapping – Step by Step
Here’s a step by step accounting of the manual process by which one local paper maps out their crime. What’s ...
Origami Maps
Origami seems to be a theme of the moment. First Google made the odd statement that “Mapping has come a ...

Creating Simple Maps with Microsoft Excel
Got MS Excel? Need a simple map? A little known tool in older versions of Microsoft's Excel is the ability to create simple maps from tabular data. You can create simple chloropeth, chart and dot density maps using data organized by country, state or region.

Basics of a Map
Learn about some basic design and concept elements when making a map.

Paleomap Project
Created and compiled by Christopher Scotese, from the University of Texas at Arlington, Paleomap Project is a site that uses ...

Campaign 2000 – the Recount
A spatial look at the nail biting vote recount in Florida that will decide the winner of the 2000 U.S. presidential election.

Campaign 2000 – A Cartographic Perspective
A look at the 2000 US Presidential election through campaign maps.

Geography of Fortune 1000 Companies
Data gathered from two thousand year Fortune 1000 Company ranking was mapped in order to look at any spatial patterns in their locations.

The Power of Mapping
The real value of GIS come from the ability to integrate spatial information with higher end statistical and analytical processes to derive spatial patterns not readily apparent to the observer.