
Maps and Cartography
Maps and cartography are essential tools in geography that enable us to visualize and understand the Earth’s surface and its features.
Cartography is the art and science of creating maps, which involves the use of sophisticated technology and techniques to accurately represent the Earth’s physical and cultural features.
Maps provide a visual representation of the world, allowing us to identify patterns, explore spatial relationships, and navigate through unfamiliar terrain.
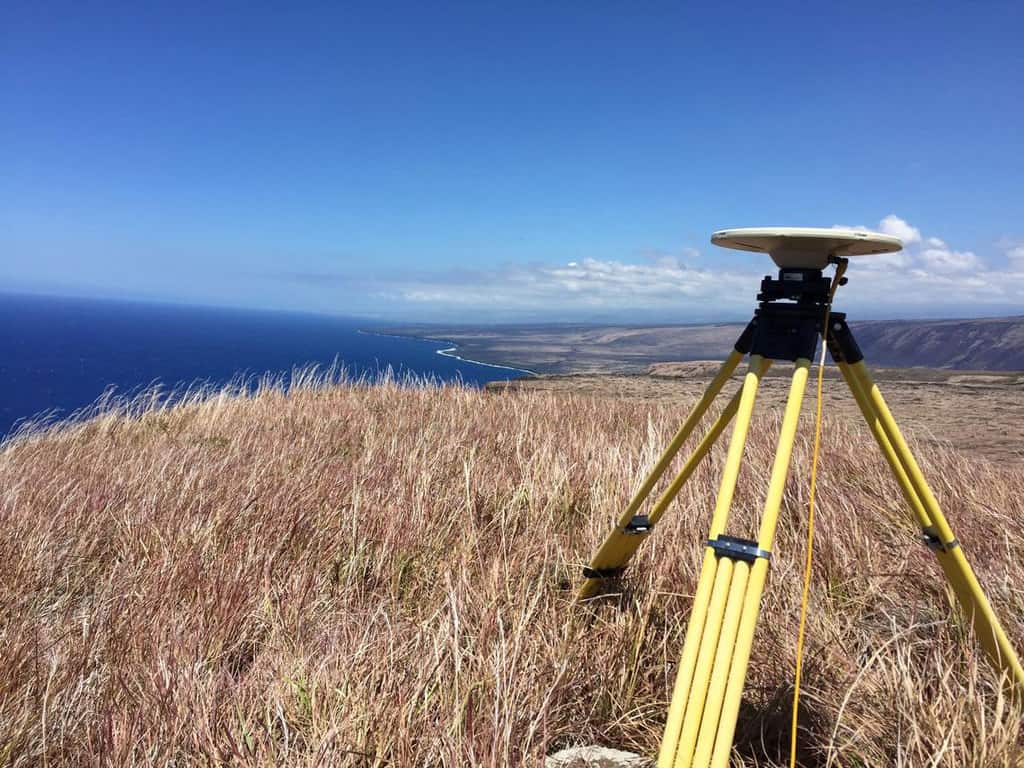
Improving the Accuracy of GPS and GNSS
To improve accuracy and signaling of GPS and GNSS, a new technique that depends on ground-based systems has been developed.
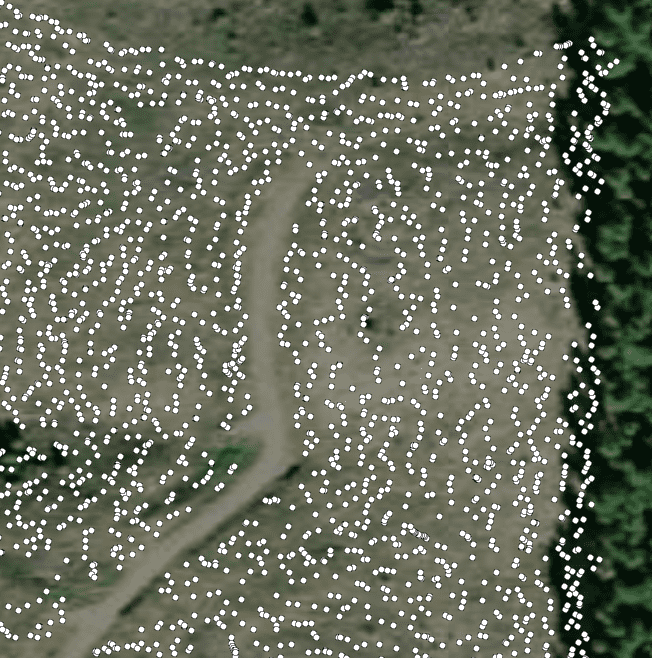
Mapping Trees During Planting
STA Logger, developed by TerraLab, can be fitted with tree planters to map the location of newly planted trees.

Walking Cane Maps
Walking cane maps, first created in 1893, featured retractable maps in cane handles. These souvenirs combined practicality with novelty.

The Map Myth of Bermeja Island
For hundreds of years, cartographers mapped Bermeja Island off the coast of Mexico, but no evidence has been found to prove its existence.
Should Maps Include a North Arrow? Exploring the Debate
Do all maps need a north arrow?

How to Measure “Land Use Mix” using Entropy in Maptitude
This article discusses Maptitude's "Land Use Mix" add-in. Municipalities utilize land use mix calculations to measure service access.

Mapping Forest Resources
Machine learning, satellite imagery, and data on forest ecology can be brought together to create better information for resource managers by mapping forest resources.

Advancements in Mapping Jellyfish: Integrating Remote Sensing and Geospatial Technologies
Mapping swarms of jellyfish has significantly improved due to a combination of remote sensing data, UAV and satellite data, and algorithms that estimate jellyfish migration based on current data.
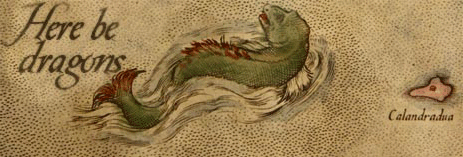
The Map Myth of Here Be Dragons: The Facts and Fictions of Mapmakers
What lies at the edge of the known world? Cartographers over the ages have used different ways of showing the unknown.

Notable Cartographers and Their Maps
Notable cartographers have shaped our understanding of the world with their maps, offering remarkable contributions throughout history.

Geographic Coordinate Systems
Geographic coordinates are defined as being north or south of the Equator and east or west of the Prime Meridian.

Cartographic Resources
Discover effective spatial data display and map design. Access resources on color representation, map layout, and showcasing geospatial information.

Book Review | The Cartographers
The Cartographers by Peng Shepherd is a suspense novel with a cartographic twist.

Turning Geospatial Skills Into a Business
Those with GIS and geospatial skills have a variety of options for launching their own businesses.

The Many Uses of Aerial Imagery
Nearmap's Tony Agresta outlines the many applications of aerial imagery, including assessing damage after a disaster, reducing crime, valuing properties, and more.

GOES-T: Next Generation Weather and Space Monitoring
The launch of the GOES-T (GOES-18) satellite provides coverage for the United States' West Coast, Hawaii, and Alaska.

First Maps
These maps are the earliest known representations of a particular geography, name, or geographical phenomenon.

Landsat 9 Data Released
Landsat 9 satellite imagery and data has been made publicly available.

Detecting Methane With Satellites
Satellite technology plays an important role in pinpointing sources of methane emissions, a vital step in mitigating this greenhouse gas.

A Look at 3 Trends Shaping Remote Sensing in the Next 5 Years
Ian Berdie of NV5 Geospatial, discusses three trends that will reshape use of remote sensing over the next five years.

AI-assisted Mapping of Crop Fields Using Free Sentinel Imagery
Mapflow offers an AI-driven process to map crop fields in QGIS.

How to Measure Hotel Market Share using the Huff Model in Maptitude
Learn how to map hotel market share to measure a city's tourism attractiveness using Maptitude.

Everything You Need to Know About LiDAR From Drones
NV5's Lukas Fraser discusses drone-based LiDAR: best use cases, how data accuracy is ensured when using drones to capture LiDAR, why LiDAR and high-resolution imagery are complementary technologies, and new market opportunities for topo bathymetric LiDAR.
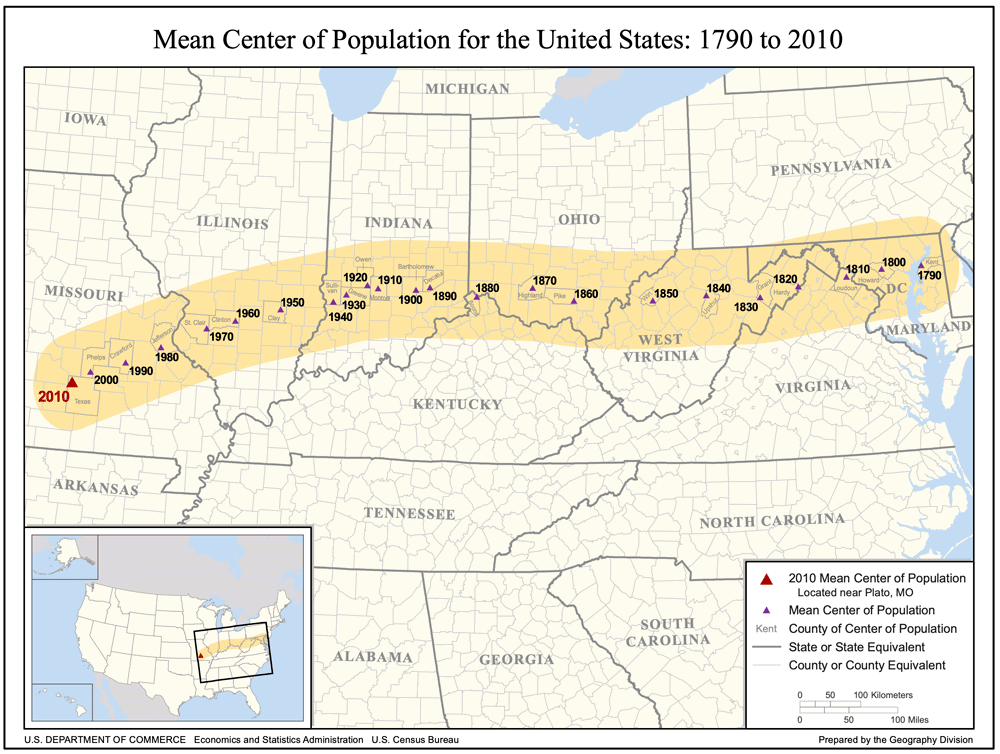
Population Geography of the United States
The United States represents a vast area of land with 3.79 million square miles (9.83 million square kilometers) in size. A ...
![[Map of California shown as an island], Joan Vinckeboon, ca. 1650.](https://www.geographyrealm.com/wp-content/uploads/2021/08/map-california-island-1650-Vinckeboons.jpg)
California as an Island
Well into the 17th and 18th centuries, cartographers created maps of the region showing California separated from the mainland by a strait.

GIS and Building Safety
Both during the construction phase, and after, building safety can be better modeled and understood using GIS.