

The Radiance Light Trends website offers an interactive map where users can see how night light pollution has changed between 1992 to the present.
Data is pulled from two satellites. Data from 1993 to 2013 is from the now defunct Operational Linescan System of the Defense Meteorological Satellite Program (DMSP) satellites. Data from 2012 to the present is collected from the Day/Night Band of the Visible Infrared Imaging Radiometer Suite instrument (VIIRS DNB).
Night light pollution creates a host of problems from disrupting wildlife to causing sleep disorders in humans.
Collectively, the data allows users to see a map and view trend data of light emissions from Earth at night. Users can search for an area on the map to extract light emission data for. Once zoomed in, users can then designate the area on the map they want to get light emission trend data for.
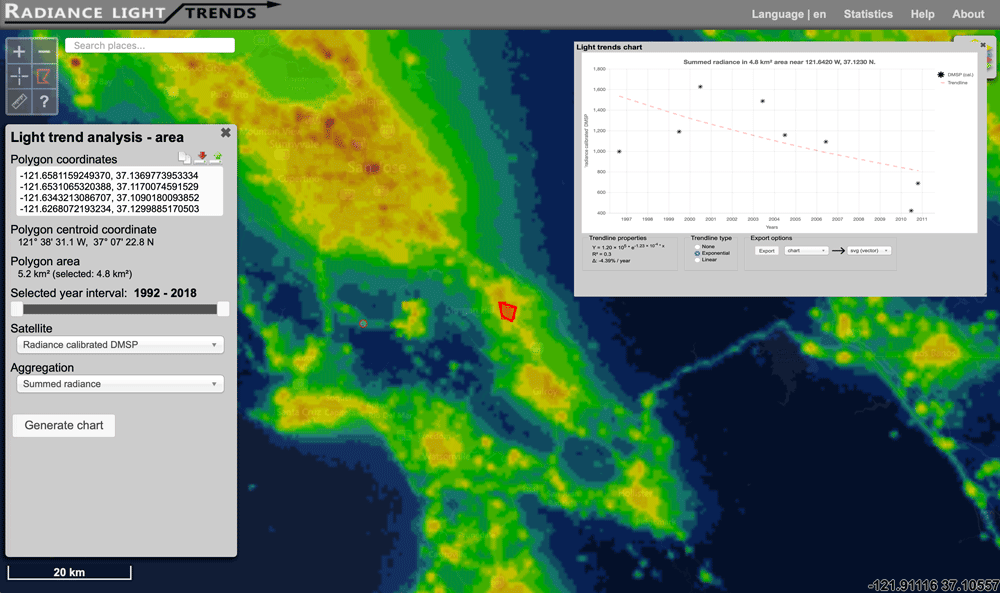
New data is added monthly as NOAA releases updated VIIRS DNB night lights products. The development of the web site was funded via the European Union’s Horizon’s GEOEssential project and was spearheaded by Christopher Kyba, a physicist at the German Research Centre for Geosciences in Potsdam.
Visit: Radiance Light Trends
