
remote sensing

Tracking Penguin Colonies Through Their Droppings
Researchers are using satellite imagery to map Antarctica’s penguin population by estimating their numbers based on the large guano stains left behind.

Mapping Wildfire Movement
The Fire Events Data Suite is being used to map near real-time wildfire behavior including fire perimeters, active front, and total burned areas.

The Global Evaporation of Lakes
Researchers used satellite imagery and modeling to calculate the evaporation volume across over 1.42 million natural and artificial lakes.

Lidar Explained
Lidar is a technology developed to map the elevation of features on and below the surface of the Earth.

Satellite Imagery of the Widest River in the World
The Copernicus Sentinel-1 mission captured this satellite image of the Amazon river that has been processed by the combining of two polarisations into one image.

Mapping California’s Heatwave from Space
NASA's Ecosystem Spaceborne Thermal Radiometer Experiment (ECOSTRESS) has been mapping temperatures across parts of California from space.


View From Space: Australia’s Wildfires
The Moderate Resolution Imaging Spectroradiometer (MODIS) on NASA’s Aqua satellite acquired a natural-color image acquired this image of smoke rising from wildfires burning in New South Wales (NSW) and Queensland.

Using Satellites to Map Air Pollution from Wildfires
The Copernicus Sentinel-5P mission is designed to monitor pollutants entering the atmosphere because of major forest fires.

Satellite Imagery Shows How Much of South Dakota’s Flooded Fields Were Unable to be Farmed
In August of 2019, the U.S. Department of Agriculture reported that South Dakota had 3.9 million “prevented planting” acres.

Himalayan Glacier Melt Mapped By Analyzing Old Spy Photographs
Declassified Cold War-era spy satellite photographs have shown how much the melting of hundreds of Himalayan glaciers has accelerated in recent decades.

Mapping Ground Movement From the 2019 California Earthquake with Satellite Data
Researchers with NASA's Jet Propulsion Laboratory have used satellite data to map out surface displacement from the 2019 California earthquakes.
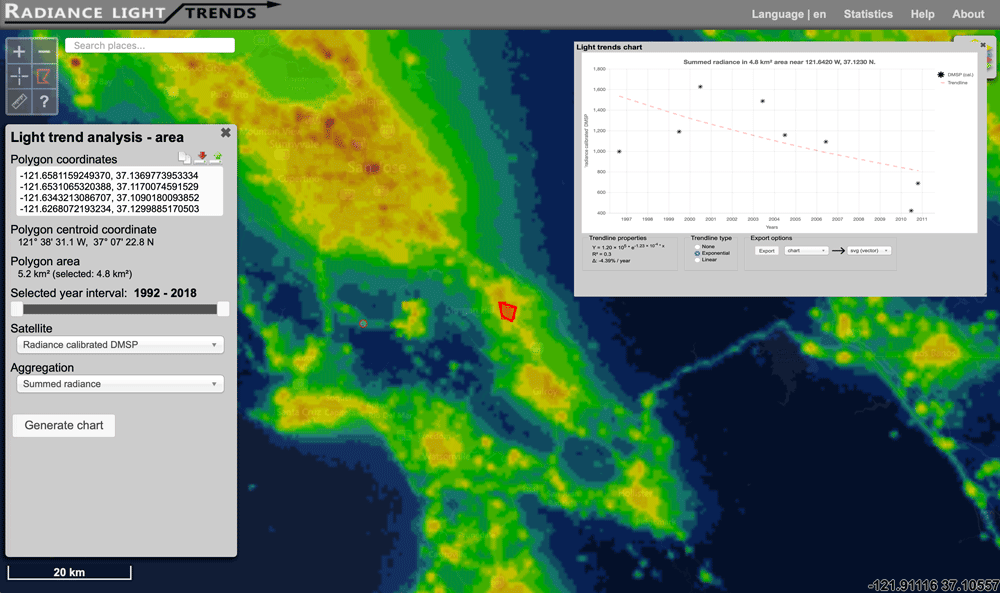
Interactive Map of How Nighttime Light Pollution Has Changed Around the World
The Radiance Light Trends website offers an interactive map where users can see how night light pollution has changed between 1992 to the present.

Who Coined the Term ‘Remote Sensing’?
While the origins of remote sensing can be traced to World War II's use of radar, sonar, and thermal detection technologies, the use of the term 'remote sensing' wasn't coined until the late 1950s.

Ground Movement in Norway
Data from InSAR Norway has helped the Geological Survey of Norway learn where there are areas of significant ground movement in both natural and urban areas of Norway.

How Much of the Earth is Covered by Clouds?
Exactly how much of the world is covered in clouds?

Nighttime Illumination Continues to Grow Worldwide
A new study used remotely sensed data from an earth observation satellite to analyze the rate of increase in artificial night lights between 2012 and 2016.

Map of Cold and Hot Temperature Anomalies Across the World
NASA has compiled a temperature anomaly map of the world using data acquired between December 26, 2017 and January 2, 2018.

Scientists are Improving How They Track Hurricanes with New Satellites
The Atlantic hurricane season in 2017 has given researchers the opportunity to perfect some of their previous methods and put into practice new instruments used to track hurricanes.

How Deep are the Earth’s Tectonic Plates?
Researchers have been able to create a better picture of tectonic plates by using both earthquake vibrations and seismic waves.

View the Human Footprint on this Rotating Globe
View the global human footprint map developed from 180,000 satellite images.

Satellites Delve into the Depths of One of the Earth’s Largest Ecosystems
Satellite imagery is helping marine scientists gain new understanding of ocean ecosystems.

Measuring the Ocean’s Magnetic Field with Satellites
The European Space Agency’s Swarm satellites are investigating the Earth’s magnetic field and the part that shifting ocean tides play.

This Interferogram Shows Ground Displacement in Italy as a Result of the Recent Earthquake
The European Space Agency posted an interferogram showing ground displacement as a result of the recent earthquake in Italy.

Changes in Arctic Environments
Using remote sensing, a team of researchers is studying the fragile arctic environments of Northwest Siberia and how resource extraction and a warming climate affect vegetation, permafrost, and energy budgets.

How Many Lakes are There in the World?
Using high-resolution satellite images, researchers created the GLObal WAter BOdies database (GLOWABO), which includes all lakes larger than 0.002 km2.