
Climatology
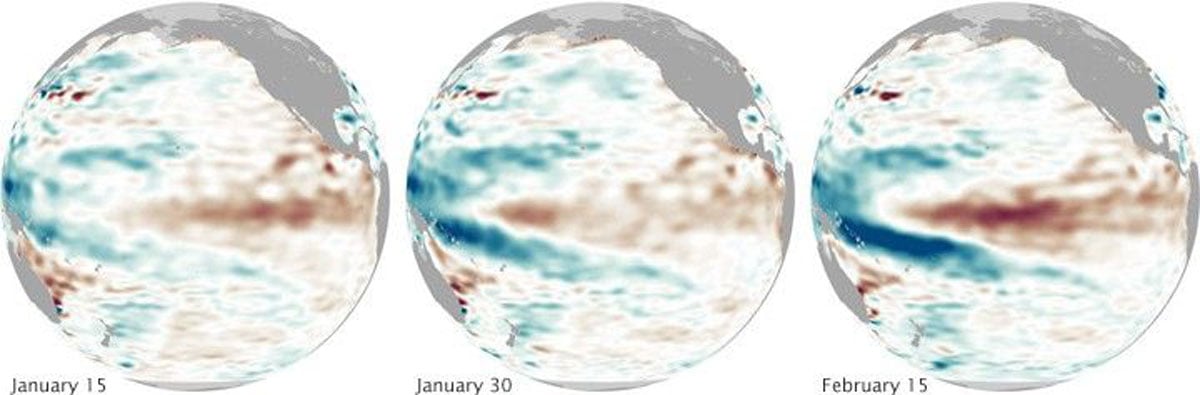
How Remote Sensing Helps NOAA Monitor El Niño
Learn how satellites measure ocean temperatures, sea surface height, and other indicators used to monitor El Niño.

Satellite Imagery of Clouds
Listed here are different clouds formations as seen on satellite imagery.

Hydroclimate Whiplash: the Impact on California Wildfires
Rapid shifts between extremely dry and unusually wet conditions are reshaping California’s fire landscape by increasing vegetation growth, drying fuels, and contributing to more intense wildfires.

Lenticular Clouds
Lenticular clouds are lens-shaped formations that form over mountains when moist air cools and condenses, creating smooth, often UFO-like cloud patterns.

How Undular Bores Show Up in the Clouds
Undular bores create distinctive wave-like cloud patterns, such as morning glory clouds, by pushing warm air upward.

Using Satellite Data to Map Extreme Heat
As heatwaves grow more frequent and severe, scientists use remote sensing and Earth system models to monitor and forecast extreme heat.

Weather Forecasting Using Artificial Intelligence
GraphCast is a Google DeepMind effort that uses deep learning to improve medium-range weather forecasting.

Using Animals to Collect Weather Data
Attaching sensors to wildlife could give scientists fine-scale weather data from the habitats animals move through.
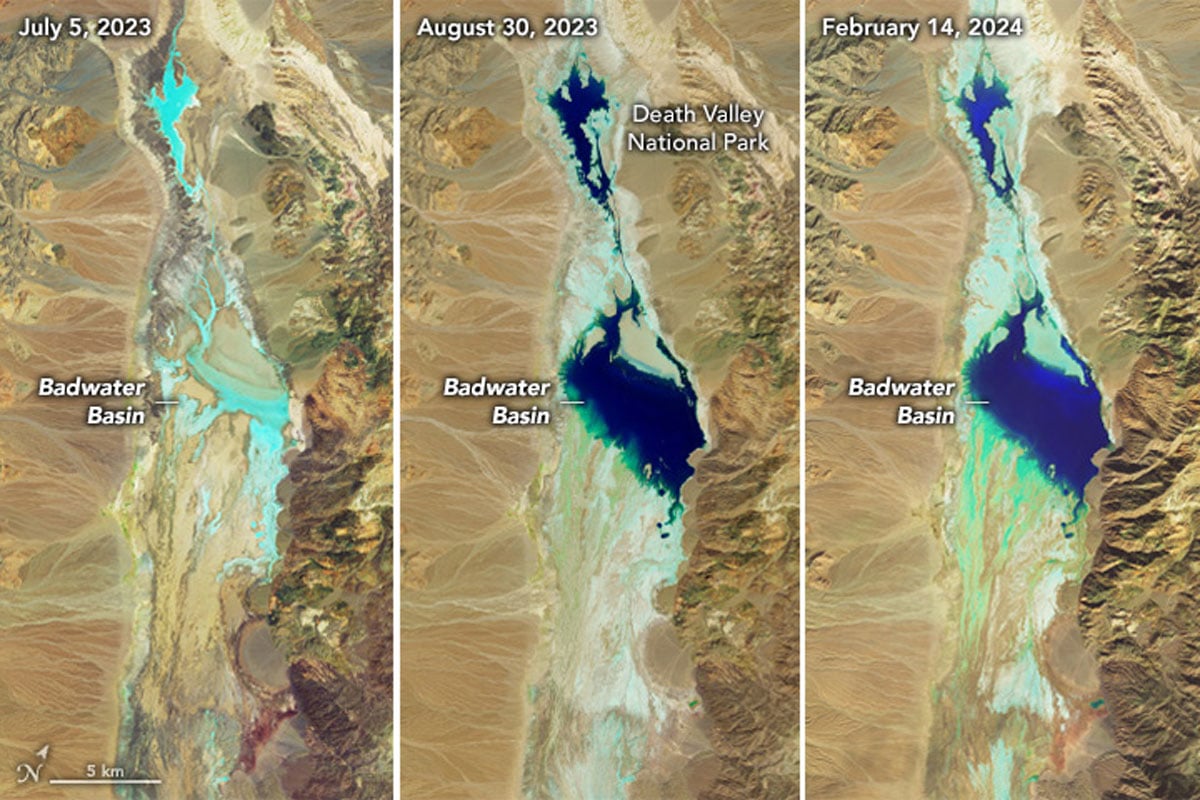
North America’s Lowest Point on Land is Currently a Lake
Two recent heavy rainfall events have filled Badwater Basin, the lowest point in North America on land, up with water.

Geography of Lightning Strikes in the United States
Researchers recently mapped out data from the U.S. National Lightning Detection Network (NLDN) between 2017 and 2022 to see where lightning strikes the most across the contiguous United States.

What is the Outlook for California’s Atmospheric Rivers?
During the winter months, atmospheric rivers carry enormous amounts of water to the state of California.


What is Snowliage?
Snowliage is when an early winter storm creates a bright white snowfall that contrasts with the red, oranges, and yellow fall foliage of trees.

When Will We Reach the 1.5°C Mark with Climate Change?
The Earth is 1°C warmer than pre-industrial times, and it's unclear when we'll reach the 1.5°C climate threshold.

Using Satellites to Map Arctic Amplification
Scientists are using remotely sensed data from Earth observation satellites to map and study Arctic amplification.

El Niño Has Arrived
After a triple dip of La Niña conditions spanning three years, researchers have officially declared the onset of El Niño on June 8, 2023.

Cities are Changing Cloud Formations
Researchers looked at cloud patterns over urban areas for 447 cities in the United States using satellite imagery.

Lake Effect Snow
Lake effect snow can occur when dry, cold air moves across a vast lake with warm waters, resulting in a snowfall event.

Triple Dip La Niña Event
Current predictions have given La Niña a strong probability of persisting into 2023, making it a triple dip event.

Circumhorizontal Arc: Rainbow in the Clouds
When conditions are just right, clouds can act like prisms, turning the rays of the sun into a brilliant color show.

Cloud Streets
Cloud streets are cumulus clouds that form in long bands along cylinders of rotating air and are roughly parallel to the ground.

What are Actinoform Clouds?
Actinoform clouds are typically found along large Western landmasses over the ocean and were first seen on satellite imagery in the 1960s.

How El Niño and La Niña Affect Rain in the United States
El Niño and La Niña are weather patterns that frequently have a considerable impact on the western and southwestern United States.

How Did Ida Turn Into Such a Strong Hurricane?
Oceanographer Nick Shay explains how eddies, part of what’s known as the Loop Current, help storms rapidly intensify into monster hurricanes.
4 Things to Learn About Hurricane Ida
These four resources explain why the New Orleans area is at high risk for severe hurricanes and what role climate change plays in these devastating storms.

These Clouds Only Predictably Form in Australia
Morning Glory clouds are a unique and rare cloud formation only predictably seen in the Gulf of Carpentaria in Australia during spring.