
The second highest mountain in Iceland has been exhibiting heightened activity since mid-August. As a results causing thousands of local earthquakes, and spewing lava has been detected with the activity has threatened air travel. Bárðarbunga (also known in English as Bardarbunga) measures 2,009 metres (6,591 ft) in elevation and is a stratovolcano located under the Icelandic glacier of Vatnajökull.
Several agencies have been monitoring the active of theBárdarbunga volcano and satellite imagery and maps have been released, tracking the plumes emanating from the volcano and seismic activity.
Satellite Imagery of the Bárðarbunga (Bardarbunga) Volcano
On September 5, the Icelandic Met Office reported that two new fissures had developed south of the initial eruption site. The Moderate Resolution Imaging Spectroradiometer (MODIS) on NASA’s Terra satellite captured this view of the eruption on September 5, 2014, at 12:50 p.m. local time.

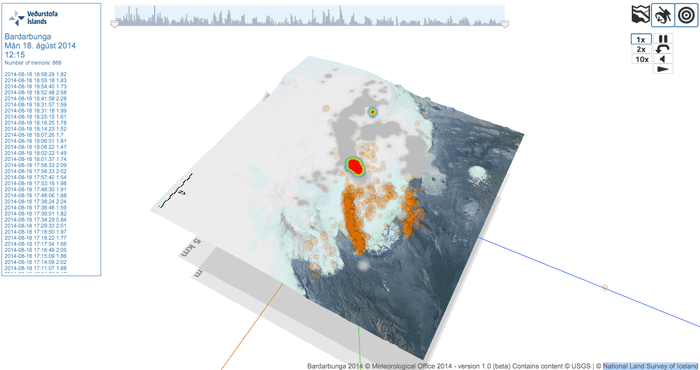
Mapping Seismic Activity from the Bárðarbunga (Bardarbunga) Volcano
This 3D map uses WebGL to show seismic activity at below the surface from Bárðarbunga during the latter half of August. You can toggle between the map view and satellite imagery view and use your curser to zoom and swirl the map around. The interface is all in Icelandic but when loaded in Chrome, Google offers the ability to translate the page to English. The interactive map was produced by the Icelandic Met Office which offers a wealth of information and maps about Bárðarbunga’s activity.

Mapping Bárðarbunga’s Plumes
The European Space Agency’s (ESA) Volcanic Ash Strategic Initiative Team (VAST) and Support to Aviation Control Service (SACS) have been monitoring the spread of sulphur dioxide from the volcano. The latest release from ESA shows an animated map showing the spread of sulphur dioxide toward’s continental Europe from Iceland between August 31 and September 4, 2014.

Further Resources
Earth Observatory (2014, September 4) Infrared Views of Bárdabunga.
Icelandic Met Office (2014, September 5) Bárdarbunga – updated information. Accessed September 5, 2014
Smithsonian Global Volcanism Program (2014, September 5) Bárdarbunga. Accessed September 5, 2014.