
Charles Minard’s Map of Napoleon’s Russian Campaign of 1812
One of the most famous maps incorporating time was created in 1861 by Charles Minard, a French Engineer. The map and chart, entitled, “Carte figurative des pertes successives en hommes de l’Armée Française dans la campagne de Russie 1812-1813″, brilliantly illustrated the march to and from the Polish-Russian border to Moscow by Napoleon’s army and was profiled in the article, Spatial Unmapped on GIS Lounge.
422,000 soldiers began the journey in June of 1812 towards Moscow and only 10,000 made it back to the border after the failed invasion. Minard’s map has been acclaimed by many for its clear use of geography and time to show how devastating the invasion of Russia by France was on the troops.
[accordion]
[toggle title=”Disclosure Statement”]GIS Lounge is a participant in the Amazon Services LLC Associates Program, an affiliate advertising program designed to provide a means for sites to earn advertising fees by advertising and linking to amazon.com. Amazon, the Amazon logo, AmazonSupply, and the AmazonSupply logo are trademarks of Amazon.com, Inc. or its affiliates.[/toggle]
[/accordion]
Noted statistician and Yale professor, Edward Tufte, declared in his 1983 book The Visual Display of Quantitative Information![]() , that the Minard graph “may well be the best statistical graphic ever drawn.”
, that the Minard graph “may well be the best statistical graphic ever drawn.”

Mapping Time
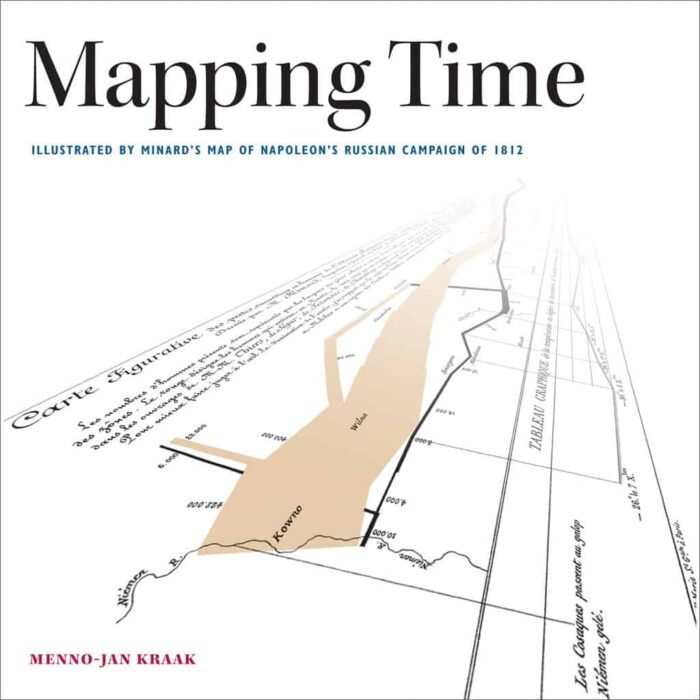
Esri Press has recently released a book inspired by Minard’s Map entitled, Mapping Time:
Published by Esri Press, Menno-Jan Kraak’s book Mapping Time: Illustrated by Minard’s Map of Napoleon’s Russian Campaign of 1812 combines historical and geographic analysis with cartography to examine mapping change over time.
The book includes more than 100 full-color illustrations inspired by graphic innovator Charles Minard’s classic flow line map of Napoleon’s disastrous invasion of Russia.
Kraak is a professor of geovisual analytics and cartography at the University of Twente in Enschede, Netherlands who has also written the textbook, Cartography, Visualization of Geospatial Data.
Book details: Mapping Time: Illustrated by Minard’s Map of Napoleon’s Russian Campaign of 1812 is available in print (ISBN: 9781589483125, 168 pages, hardcover) and e-book format (ISBN: 9781589483668).