
Geospatial company GIS Cloud partnered with the Milwaukee Continuum of Care (CoC) and the State of Wisconsin in order to develop and implement a way to count the city of Milwaukee’s homeless population. The city along the southwestern shore of Lake Michigan is the 31st most populous city in the United States. There are more than 1,500 homeless men, women, and families in the Milwaukee area.
The bi-annual Point In Time Count survey happens every January and July. The survey is a statistically reliable, unduplicated count of people experiencing homelessness during a designated one-night period. This Point In Time Count survey serves to capture the number of individuals who are homeless and living in Emergency Shelters, Safe Havens, and Transitional Housing as well as persons on the street of another place not meant for human habitation.
Challenges of Developing the Homeless Population Count Survey
There were a few challenges to for developing a system with GIS Cloud to enhance counting mechanism for identifying the homeless population in Milwaukee City/County such as:
- the ability to track locations overtime
- communicating where other outreach teams have already visited
- using the notes options for tracking the number or people who took the survey, the number who refused, or stated they were not homeless
- use the data gathered for further data tracking

Using a Mobile Data Collection App
During the event, local Milwaukee shelter agencies, numerous advocates and volunteers conducted interviews on homeless individuals to obtain different types of feedback using Mobile Data Collection app. Prior to going to the field, a custom form was created using Mobile Data Collection Portal so that all the data collectors would have the same form, simplifying and unifying the process.
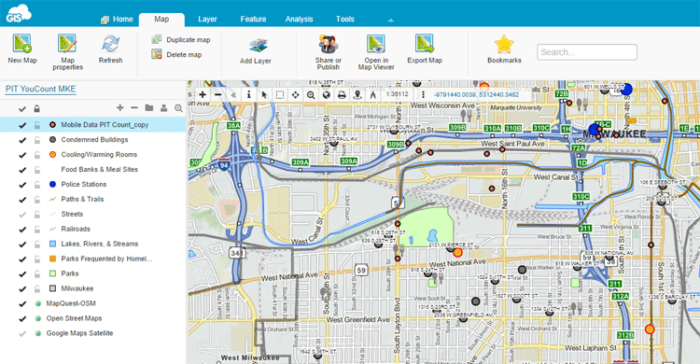
Using the MDC app, real time information was obtained on how or why a person becomes homeless, the current length of homelessness, recidivism, and chronic homelessness. Data was able to be reviewed directly from the field and also cross-referenced with data from previous collections. Existing collected data was uploaded to Map Editor, along with other types of data like streets, police station locations, parks, food banks, meal sites etc. Adding these different types of data made the map more intuitive for the later on analysis when identifying and analyzing different homelessness patterns.
Results
Combining the PIT method and GIS Cloud apps, this undertaking accomplishes more in one day than what might normally take several months. This is an example of how to extend your workflow to Cloud, making it faster, efficient and accurate by using what you have, creating and collecting new as well as collaborating between you and your data collection team.
- real time data collection based on a custom form specified for City of Milwaukee’s project
- possibility of having multiple users collecting data simultaneously
- upload and use previously obtained data in different vector and raster formats
- review and edit existing data from the field and office
- make custom maps to use in field data collection as well as in office analysis
- export all the data in different formats and continue using the data in different Desktop
