
The science of deoxyribonucleic acid (DNA) has revolutionized many fields within biology, historical sciences, ecology, and other related areas. While DNA alone has made many revolutionary advances in how we are understanding our world, using DNA studies with GIS has proven also to add new knowledge.
In recent years, spatial analysis has supplemented our understanding of genetic variation and DNA studies.
At one level, GIS and spatial analysis can assist in mapping and forecasting where given genetic variation of given species could be found. This is particularly important for finding difficult to detect species that require monitoring.
For instance, in a recent study by Sakai et al. (2019), the authors found that by using spatial analysis and GIS to determine likely characteristics of given regions, the endangered and rare Yamato salamander (Hynobius vandenburghi) was detectable and DNA variety could be studied by collecting samples from identified areas where the salamander was likely to be found. Integrating different habitat characteristics in spatial layers aids in increasing the probability of finding something generally hard to detect.[1]
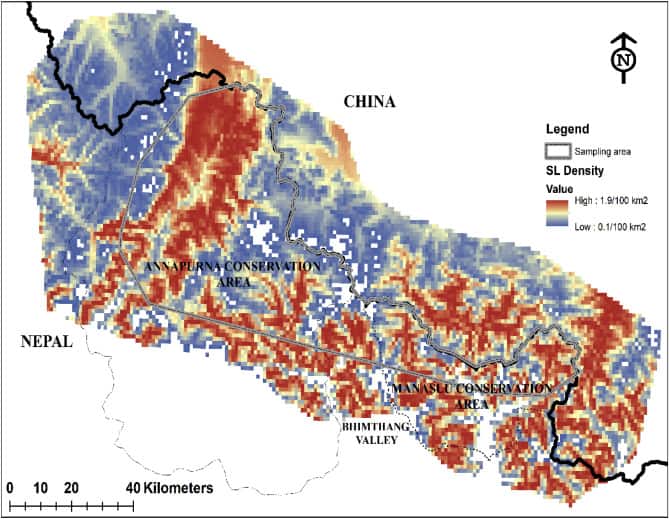
Another recent study used fecal matter from snow leopards to estimate not only their range but also density across vast areas in Nepal using maximum likelihood based spatial capture recapture analysis. The authors were able to determine that previous studies likely over-stated populations due to overlapping ranges.
By collecting DNA from given species’ fecal remains, one can determine if they are also monitoring the same or different individual animal, helping to refine models and estimates of the species in given areas.[2]
A similar study was also used to monitor the rare Sumatran elephant, where numbers of these animals are not only low but it is also important to monitor the age and sex of individuals to better understand the viability of herds over the long-term.[3]

Genetic studies have also helped better understand the past, including when given species and even when humans arrived in areas.
In one study, it was determined that a type of chestnut found in Britain and Ireland has its origins in Western Europe. In this case, samples from Ireland and Wales/England cluster differently, indicating divergence within the species and change over time in how the species moved along outer areas of Europe.[4]
Another recent study studied human genetics from the Caucasus region, showing that pastoralists and farmers in the area began to separate and migrate during the Bronze Age. This began to influence the genetics of later and modern populations in these regions, demonstrating long-term effects on populations.[5]
It is clear DNA studies have revolutionized understanding in a variety of fields. However, combining spatial analysis and GIS can enhance understanding by showing where and explaining possibly how genes spread.
We can see that DNA and spatial analysis also help to conserve endangered species and help monitor animals that are rare or difficult to find. Other applications are likely and with improvement in our ability to extract DNA samples should lead to more advancements, particularly with the use of GIS and spatial analysis.
References
[1] For more information on studying (Hynobius vandenburghi), the Yamato salamander, using GIS and DNA studies, see: Sakai Y, Kusakabe A, Tsuchida K, et al. (2019) Discovery of an unrecorded population of Yamato salamander ( Hynobius vandenburghi ) by GIS and eDNA analysis. Environmental DNA 1(3): 281–289. DOI: 10.1002/edn3.31.
[2] For more on snow leopard ranges and numbers using DNA and spatial anlaysis, see: Chetri M, Odden M, Sharma K, et al. (2019) Estimating snow leopard density using fecal DNA in a large landscape in north-central Nepal. Global Ecology and Conservation 17: e00548. DOI: 10.1016/j.gecco.2019.e00548.
[3] For more on the elephant study using DNA and spatial anlaysis, see: Nofinska BA, Sumayyah S, Andayani N, et al. (2019) Determination of sex, age, and spatial distribution of sumatran elephant (Elephas maximus sumatranus) in Bukit Barisan Selatan National Park. In: PROCEEDINGS OF THE 4TH INTERNATIONAL SYMPOSIUM ON CURRENT PROGRESS IN MATHEMATICS AND SCIENCES (ISCPMS2018), Depok, Indonesia, 2019, p. 020073. DOI: 10.1063/1.5132500.
[4] For more on DNA of chestnuts and spatial analysis, see: Jarman R, Mattioni C, Russell K, et al. (2019) DNA analysis of Castanea sativa (sweet chestnut) in Britain and Ireland: Elucidating European origins and genepool diversity. Aravanopoulos FA (ed.) PLOS ONE 14(9): e0222936. DOI: 10.1371/journal.pone.0222936.
[5] For more on genetics in the Caucasus and populations, see: Wang C-C, Reinhold S, Kalmykov A, et al. (2019) Ancient human genome-wide data from a 3000-year interval in the Caucasus corresponds with eco-geographic regions. Nature Communications 10(1): 590. DOI: 10.1038/s41467-018-08220-8.