
A newly published article by a group of researchers called the Open COVID-19 Data Curation Group in Nature’s Sci Data decribes how epidemiologists collected and curated individual-level novel coronavirus data from a variety of national, local, and news sources. In order to analyze and track the COVID-19 pandemic, the data was geocoded so that it could be mapped and visualized. This data is intended to provide epidemiologists with a tool for generating real-time data that can be used to detect emerging outbreaks and make public health decisions.
The open access article is entitled, “Epidemiological data from the COVID-19 outbreak, real-time case information.” In it, the authors describe how they collected coronavirus case information from a variety of governmental sources. This information was coupled with media and online reports to supplement information about each individual’s travel history, symptoms, and key dates of illness onset, admission, and confirmation. All of the data was then geocoded to the district level to prevent case identification. A master database of geographic locations was used to standardize place names by providing a a common geographic reference table. The authors used translators skilled in English, Mandarin Chinese, Cantonese, Spanish, and Portuguese to correctly associate variations in local place names. In addition, geographic context was used to ensure that names that occur in more than one location within a country were correctly placed.

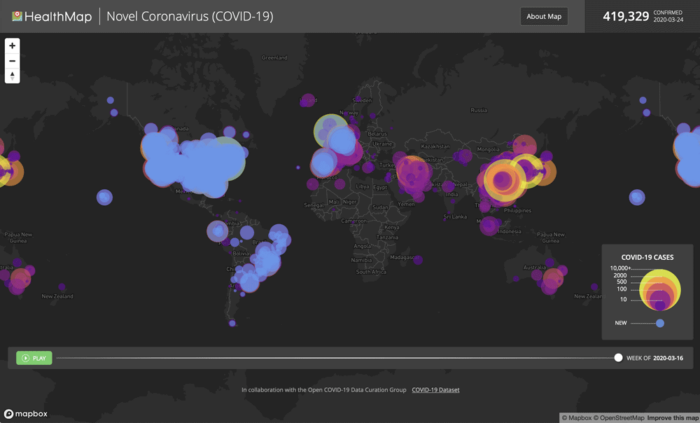
An interactive map showing real-time visualization of the novel coronavirus data was created with MapBox. Where available, this interactive displays summary case information both at the country or state (U.S.) level (as a graduated circle geocoded to the center of each region) and by county or region. A timeline tool at the bottom of the map autoplays a week-by-week overview of coronavirus cases starting with the week of January 6.
This map can be viewed at
Download GIS Data for Novel Coronavirus Confirmed Cases
The authors have made the live data used on Healthmap available via Github: beoutbreakprepared/nCoV2019. The coronavirus data, available in the “latest data” folder can be dowloaded as a CSV file and contains latitude/longitude coordinates so it can be easily mapping out within a GIS or other mapping application. The Github site also provides code for importing the data into R statistical software.
More
Xu, B., Gutierrez, B., Mekaru, S., Sewalk, K., Goodwin, L., Loskill, A., Cohn, E. L., Hswen, Y., Hill, S. C., Cobo, M. M., Zarebski, A. E., Li, S., Wu, C.-H., Hulland, E., Morgan, J. D., Wang, L., O’Brien, K., Scarpino, S. V., Brownstein, J. S., … Kraemer, M. U. G. (2020). Epidemiological data from the COVID-19 outbreak, real-time case information. Scientific Data, 7(1), 106. https://doi.org/10.1038/s41597-020-0448-0
Xu, B., Kraemer, M. U., Gutierrez, B., Mekaru, S., Sewalk, K., Loskill, A., … & Li, S. (2020). Open access epidemiological data from the COVID-19 outbreak. The Lancet Infectious Diseases. https://doi.org/10.1016/S1473-3099(20)30119-5