
GIS Data
This category contains introductory text about GIS data such as types of error in GIS datasets, types of GIS data (raster and vector), and metadata.
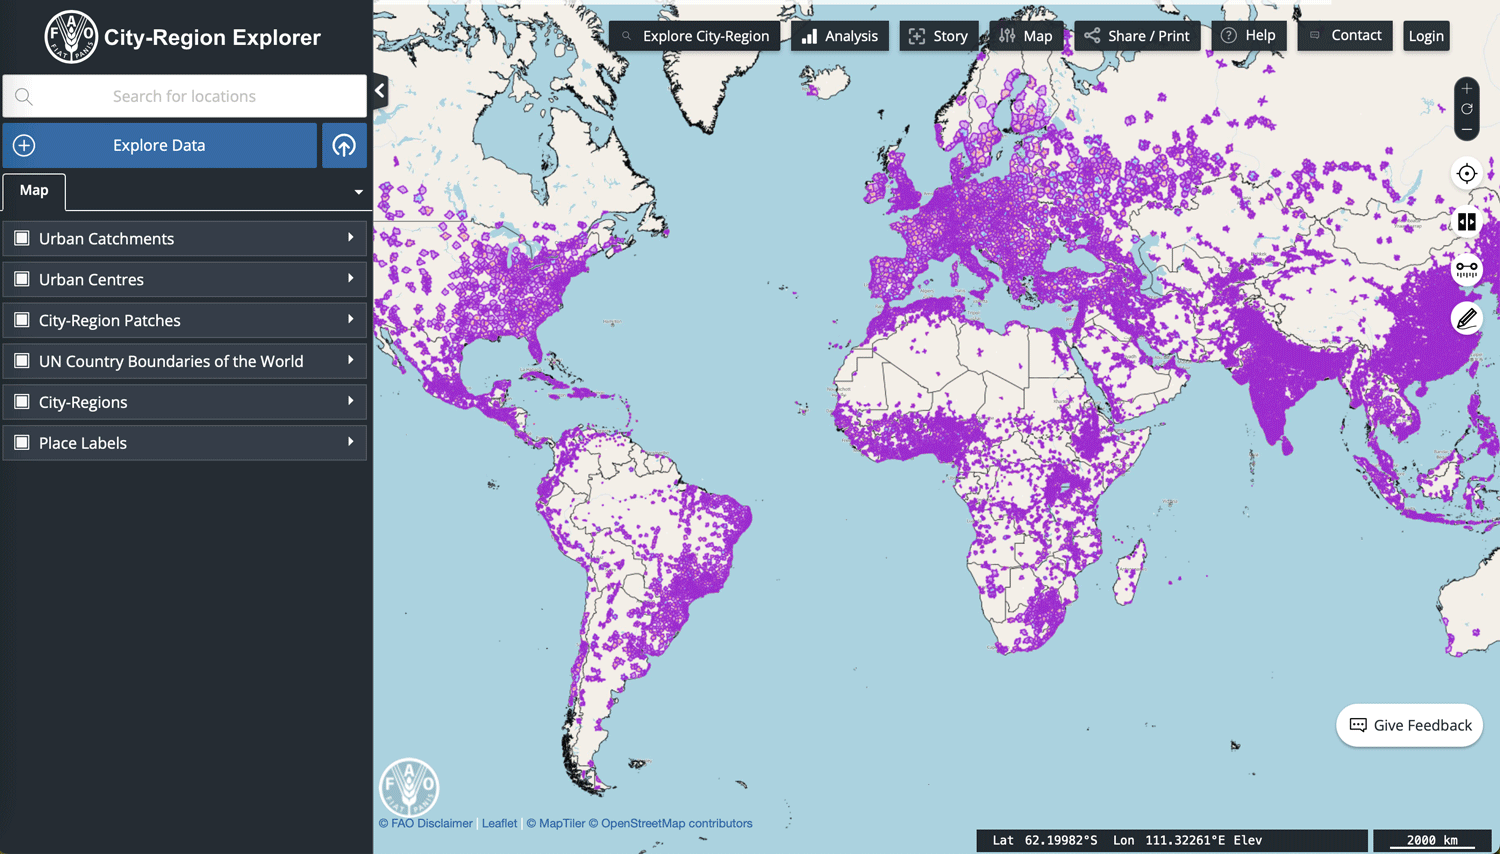
Explore the City-Regions Dataset from FAO
FAO’s global dataset maps access to towns and cities of all sizes within reasonable travel times, identifying patterns of urban interconnectedness.

Pan Sharpening in GIS
Enhance spatial detail in multispectral images with pan sharpening. Learn how this GIS technique combines data for sharper, more detailed satellite imagery.

Witness Posts
Witness posts are signs that alert visitors to the presence of a nearby survey marker.

Types of GIS Data Explored: Vector and Raster
Explore the key differences between GIS vector and raster data, and how each type supports diverse spatial analysis tasks.

Choosing the Right Satellite Bands for Remote Sensing
Learn how different satellite sensors respond to Earth's features and which spectral bands are best for remote sensing.

Relief Inversion
Telling the difference between a canyon and a mountain on aerial or satellite imagery can sometimes be tricky due to an optical illusion known as relief inversion.

Find Public GIS Data with Google’s Earth Engine Catalog
The Earth Engine Data Catalog lets users search and discover Earth observation public datasets.

A Review of the State of Crowdsourced Geospatial Data
A review in the Journal of Remote Sensing provides an updated look at the benefits and concerns when it comes to collaborative geospatial data collection.

Mapping Heat in U.S. Cities
NOAA has been coordinating an effort to map urban heat islands in cities across the United States.

A Guide to Understanding Map Scale in Cartography
Map scale refers to the ratio between the distance on a map and the corresponding distance on the Earth's surface.

Overview of Elevation Data
This article reviews some of terminology and types of elevation based datasets available to GIS.

Highly Detailed Seafloor Maps
Researchers from MBARI have developed methods to map the ocean floor at incredibly high resolution.

Mapping Coastal Ecosystem Change
A collaboration initiative, called coastTrain, helps to provide data so that scientists can better address challenges coastal regions face.

Mapping Long-term Land Use Change with Remote Sensing Data
Discover how remote sensing technology is used to map land use changes, providing valuable insights into environmental impacts and aiding conservation efforts.

GIS Data: A Look at Accuracy, Precision, and Types of Errors
What are the types of error found in GIS data? This article reviews the difference between accuracy and precision and explains the most common types of error found in GIS data.

Mapping Heat Vulnerability from Satellite Data
Satellites are being used to measure heat not only on urban heat islands, but also on farms and other locations where rising temperatures are having an impact.

Mapping the Earth’s Freshwater Bodies
Over 95% of the world's lakes, rivers, and freshwater reservoirs will be measured by a new satellite mission called Surface Water and Ocean Topography (SWOT).

FABDEM: 30 Meter Resolution Bare Earth DEM from Fathom
FABDEM is the first global Digital Elevation Model (DEM) with forests and buildings removed at a 30m resolution.

Aerial Snow Mapping
Researchers are increasingly use UAS/UAV platforms for measuring snow cover data, particularly snow depth.

Big Data and Animal Migration
Scientists are using big data methods combined with modern GPS tracking and machine learning to enhance their understanding of global animal migration patterns.
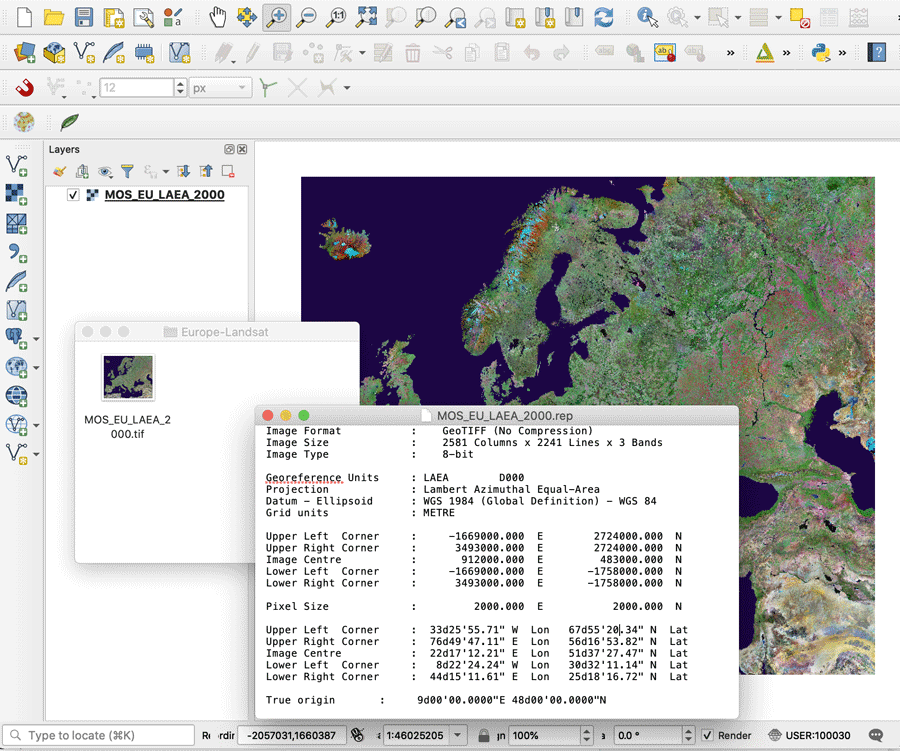
What is a GeoTIFF?
A GeoTIFF is a public domain metadata standard which has the georeferencing information embedded within the image file.

Open-Source Science in the Cloud Collaboration
NASA and the European Space Agency (ESA) released a new open source and science tool called the Multi-Mission Algorithm and Analysis Platform (MAAP).

Mapping the World’s Fungi
Scientists have created a collaborative effort, called the Society for the Protection of Underground Networks (SPUN), which aims to map and protect large areas of fungi.

Mapping Natural Carbon Storage
Scientists have created a map of the Earth where carbon needs to be stored to keep climate goals from Cop26 possible.

World Flood Mapping Tool
The World Flood Mapping Tool, developed by the UN University's Institute of Water, Environment, and Health, aims to help countries with limited data construct flood maps.

Open Topography: A Spatial Data Infrastructure for Topographic Data
Open Topography is a web-based portal for imagery and lidar data that allows users to create their own deliverables.