
Land use change has been one of the most sustained and obvious results of the Anthropocene, where deforestation, agriculture, and expanding cities have left a clear imprint on our planet.
Monitoring this change is key to understanding its impacts but also to potentially alert scientists and policy makers where change needs to happen to stop destruction of our natural environment.
Monitoring land use change
Now, the USGS’ Land Change Monitoring, Assessment, and Projection (LCMAP) initiative is helping to better monitor our fragile Earth and long-term land use change.
Initially, LCMAP was setup at USGS’s Earth Resources Observation and Science (EROS) Center. The idea was to present to scientists and the public a new generation of land cover mapping and change monitoring using higher quality remote sensing data and more frequent data releases.
The focus is on conterminous (or contiguous) United States, although data on Hawaii has also been released. Overall, data are released as part of collections that have so far covered 1985-2021.
More than satellite data, which have mostly consisted of the Landsat program, information has included processed change detection algorithmic results (using PYCCD) and supervised learning model and results information.[1]

Accessing Data from the USGS Land Change Monitoring, Assessment, and Projection (LCMAP)
Data from LCMAP are available from EarthExplorer, the LCMAP Web Viewer, LCMAP Mosaic websites, and the LCMAP WMS. (Related: USGS Releases Two Decades of Land Cover Change for the Contiguous United States)
Data in collections, such as collection 1.0 which spans from 1985-2017, provides: land cover information, confidence of land cover results, secondary land cover, secondary land cover confidence, annual land cover change, time of spectral change, change magnitude, spectral stability period, time since last change, and spectral model quality.
Benefits of using remote sensing data for long-term land use monitoring
Among different benefits, these data allow one to not only monitor land use change but also observe the quality of the results, how fast land use has changed over a given period, and what other land cover is present besides the primary observation.[2]
More recently, LCMAP’s 2021 (1.3) release extends coverage from 1985-2021.

The data can be used to monitor many different types of land use change, including the dynamics of wetlands, look at the impact of hurricanes, see how mining has impacted different parts of the US, look at coastal erosion, and understand the intensity of land use change caused by wildfires.
The benefit of different data releases is that algorithms used for classification and validation of results could be continuously improved, allowing better change detection, for instance, over the period of data coverage. These results and updates to algorithms and their improvement are often published, such as in an article that presents change detection and classification methods.[3]
While much of the data focus on the lower 48 states in the US, data on Hawaii have recently been published and an article discussing some of the results has also been published.[4]
Monitoring forest regrowth with remote sensing
Other recent results have focused on forest regrowth in the US as a way to mitigate long-term climate impacts.
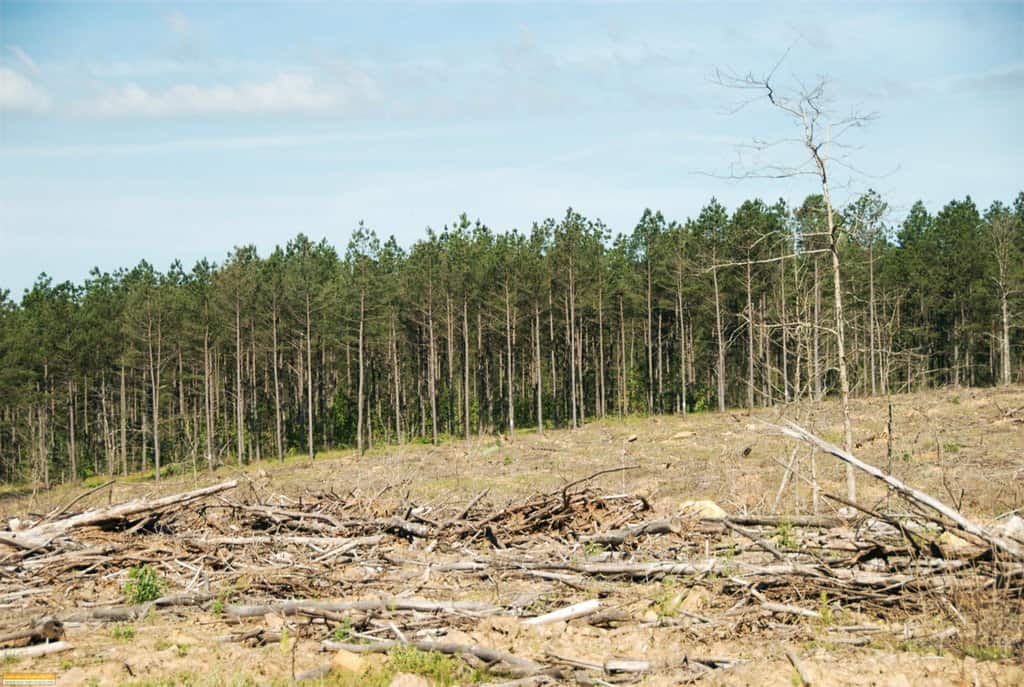
Results using LCMAP have shown that the US Southeast had the fastest regrowth in trees, averaging around 5 years to recover. This suggests efforts focused on faster growth areas could have a more rapid payoff by focusing on that region.
On the other hand, other areas might be much harder to recover their overall tree cover or at least take longer, such as the northwest taking decades to recover in cases.[5]
Long-term land use monitoring outlooks
Using LCMAP for various long-term land use monitoring will likely become more important for scientists and policy makers, particularly land use change plays such a major factor in a variety of environmental threats but also benefits.
Efforts to bring critical data together and enable an easier way to have classification and detection of land use change, without requiring this work to be done by researchers, makes the utility of Landsat data more accessible. This also now allows better planning to commence, such as where efforts to conserve forest and enable their regrowth should focus.
References
[1] For more on PYCCD, see: Killough, Brian D. 2022. ‘Satellite Analysis Ready Data for the Sustainable Development Goals’. In Geophysical Monograph Series, eds. Argyro Kavvada, Douglas Cripe, and Lawrence Friedl. Wiley, 133–43. https://onlinelibrary.wiley.com/doi/10.1002/9781119536789.ch8 (October 23, 2022).
[2] For more information on the LCMAP program and products, see: https://www.usgs.gov/special-topics/lcmap.
[3] For more on how Landsat data are understood and used for change detection and classification in LCMAP using some updates, see: Brown, Jesslyn F. et al. 2020. ‘Lessons Learned Implementing an Operational Continuous United States National Land Change Monitoring Capability: The Land Change Monitoring, Assessment, and Projection (LCMAP) Approach’. Remote Sensing of Environment 238: 111356.
[4] For more on Hawaii and classification approaches used for that state, see: Li, Congcong et al. 2022. ‘Development of the LCMAP Annual Land Cover Product across Hawaiʻi’. International Journal of Applied Earth Observation and Geoinformation 113: 103015.
[5] For more on forest recovery across the US using LCMAP, see: Zhou, Qiang et al. 2022. ‘Tree Regrowth Duration Map from LCMAP Collection 1.0 Land Cover Products in the Conterminous United States, 1985–2017’. GIScience & Remote Sensing 59(1): 959–74.