
Landsat

Choosing the Right Satellite Bands for Remote Sensing
Learn how different satellite sensors respond to Earth's features and which spectral bands are best for remote sensing.
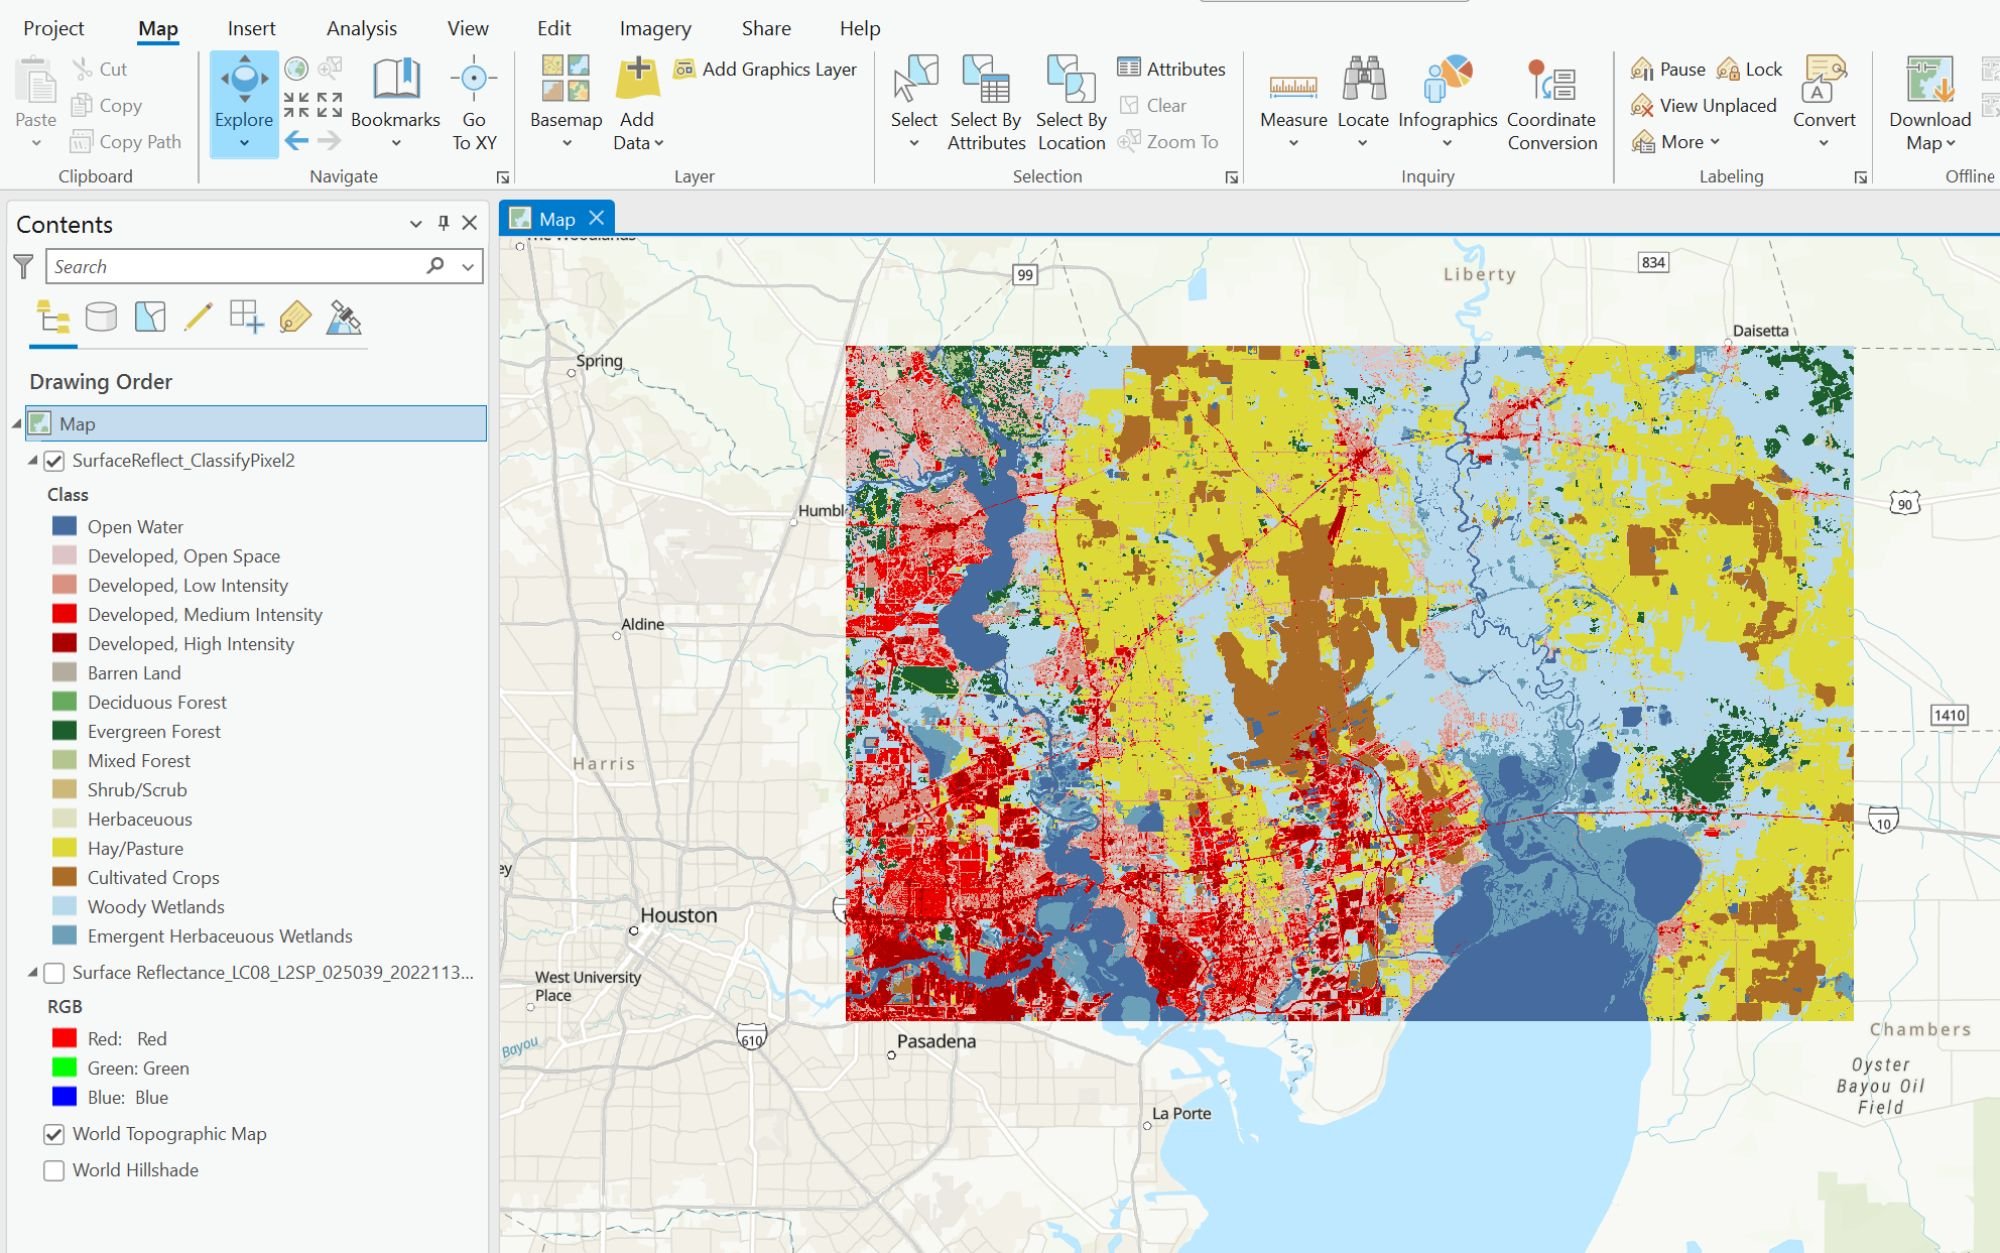
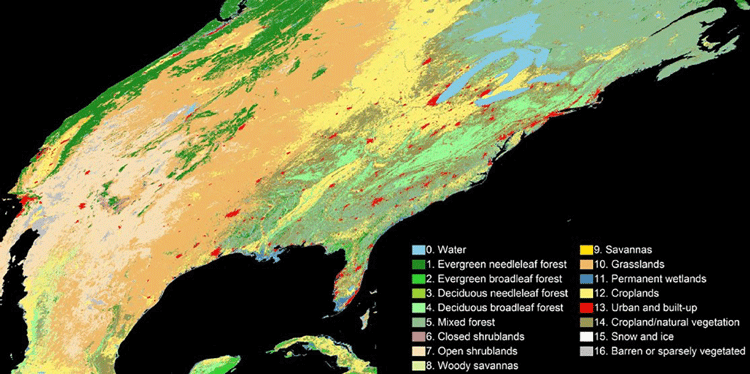
Using Deep Learning to Map Land Cover in ArcGIS Pro
This GIS tutorial provides step-by-step instructions on how to use deep learning models and Landsat 8 satellite imagery in ArcGIS to classify land cover.

Mapping Long-term Land Use Change with Remote Sensing Data
Discover how remote sensing technology is used to map land use changes, providing valuable insights into environmental impacts and aiding conservation efforts.
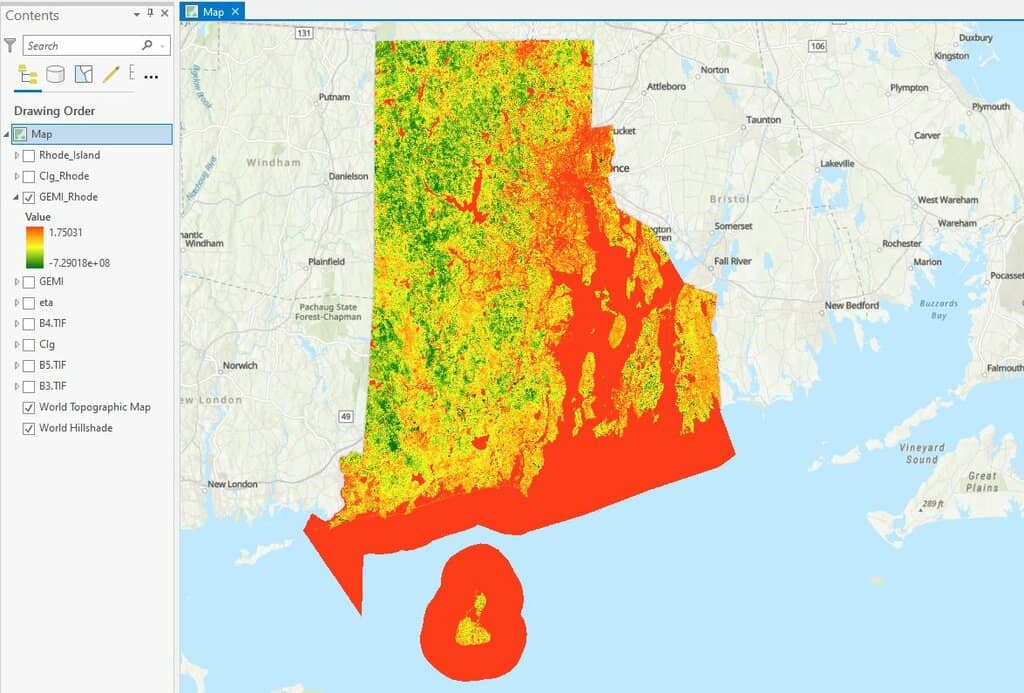
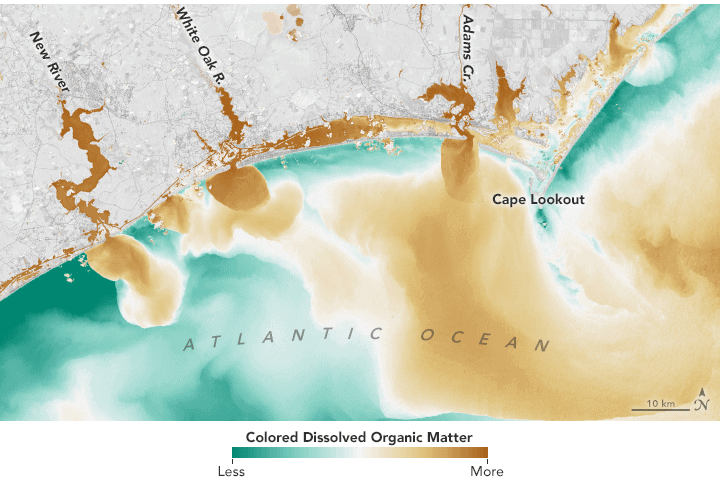
How to use ArcGIS Pro and Landsat 8 Imagery to Calculate Chlorophyll Index and Global Environmental Monitoring Index
Learn to create a chlorophyll index using Landsat 8 imagery in ArcGIS Pro with this step-by-step GIS tutorial.

Remote Sensing for Carbon Offsetting
Remote sensing and geospatial technologies are being harnessed for carbon offsetting efforts.

The Global Evaporation of Lakes
Researchers used satellite imagery and modeling to calculate the evaporation volume across over 1.42 million natural and artificial lakes.

Landsat: Longest Running Earth Imagery Program
With satellites in orbit since 1972, the Landsat program is the longest running Earth observation program.

Landsat 9 Data Released
Landsat 9 satellite imagery and data has been made publicly available.
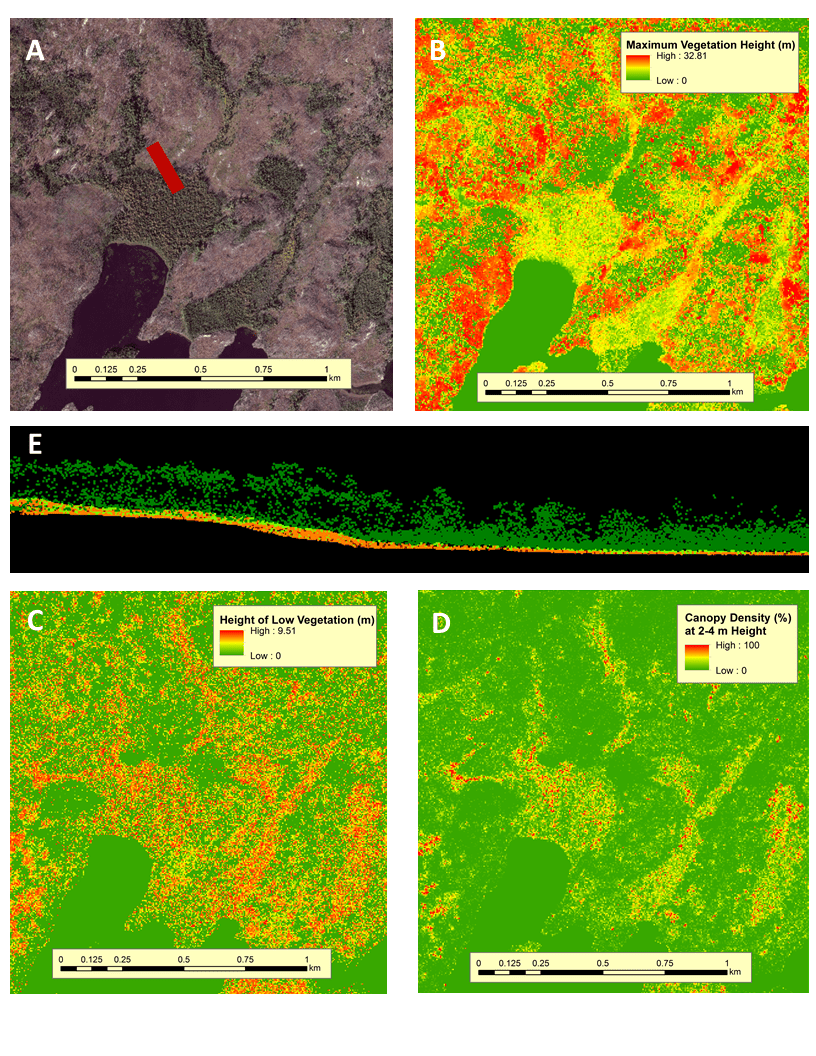
Mapping Ecosystem Health through Satellite Data
Remote sensing techniques, particularly those based on satellite, drone, and aircraft data, have revolutionized collecting ecosystem data.
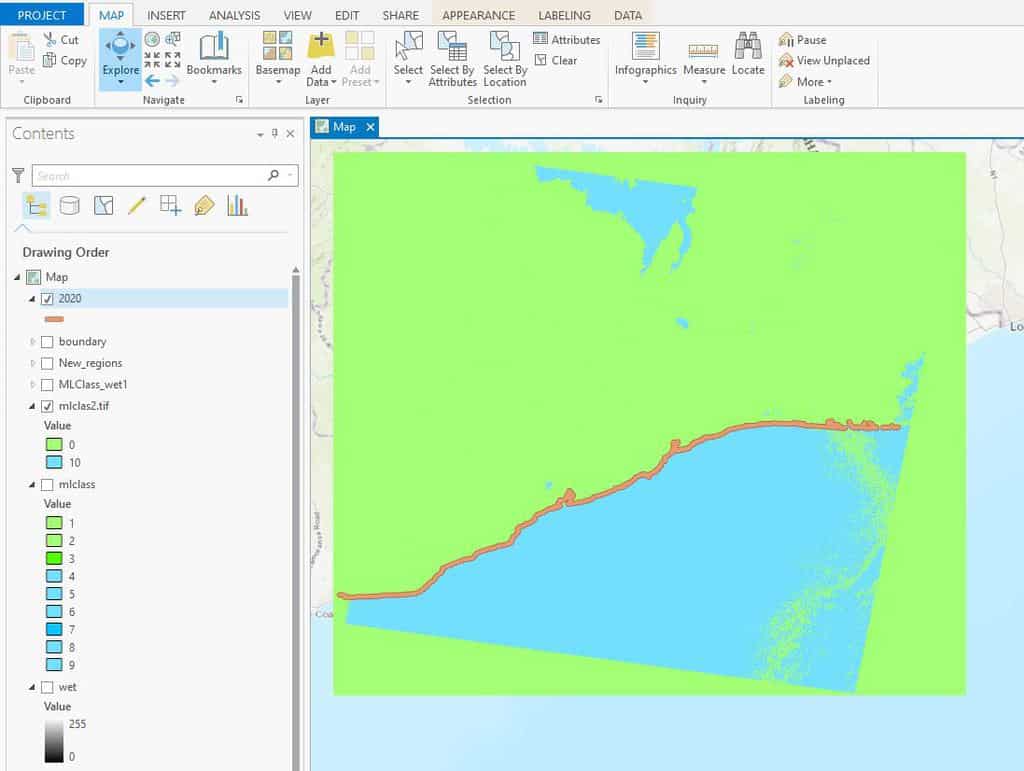
How to Use ArcGIS Pro for Automatic Shoreline Delineation from Landsat Imagery
Learn how to extract shorelines in ArcGIS Pro using the Tasseled Cap and NDVI indices with the Landsat toolkit for automatic shoreline delineation.

Geospatial Technology and Challenges of Contemporary Agriculture
Farmers have greater access to geospatial tools that can help mitigate some agricultural challenges.

Mapping Crops: Filling in Data Gaps with Landsat Archives
A recent study analyzed twenty years of Landsat data to look at corn and soybean crops across the US Midwest from 1998-2018.

Mapping Tropical Forest Quality from Satellite Data
Researchers have created high resolution maps of tropical forest quality using remotely sensed data from NASA satellites.
Monitoring Lakes Using Remote Sensing Data
Satellite-based remote sensing is proving to be a useful tool to allow effective monitoring of lakes around the world.

Monitoring Crop Production Via Satellite
To cope with ever-changing agricultural needs and conditions, the USDA’s National Agricultural Statistics Service (or NASS) uses data from Landsat to monitor crops in the contiguous United States.

New Report Values Economic Benefits of Landsat Archive at $3.45 billion
A newly released report from the USGS has estimated the 2017 domestic and international economic benefits of Landsat imagery to be $3.45 billion.

Mapping the Human Footprint
The world settlement footprint, created in a online application called Urban Thematic Exploration Platform (TEP) sponsored by the European Space Agency (ESA), is the first map that combines optical and radar satellites to create a human urban footprint map of the world.

Analyzing the Benefits of Green Space on Mental Health Using GIS
A study in Denmark combined historical Landsat satellite data and a survey to analyze the relationship between green space and mental health.

Mapping Land Cover by Stacking Landsat Imagery
Landsat 8 is offered as free, open data, which has led to new innovation in methods to better utilize such data for time series and complex scenes that are sometimes obstructed by clouds or dust.

What are the Benefits of Landsat’s Current Free and Open Policy?
A group of researchers from different universities and government groups have published a study of how Landsat's free and open data policy has benefitted users of the programs satellite imagery products.
“Adopt A Pixel” to Help Landsat Science
Adopt A Pixel program has existed for quite some time - from 2013 - in the form of a web service which allowed users to upload geospatially tagged landscape images to complement the remote sensing collections.

Tool from Sentinel Hub Lets You Create Time-lapse GIFs from Satellite Imagery
The EO Browser allows creating animated GIFs from satellite image time series. This tutorial demonstrates how to create your own time-lapse GIF.
An Algorithm to More Accurately Classify Land Cover Using Landsat Imagery
Hankui Zhang, from South Dakota State University, has developed a new classification technique that combine satellite images from MODIS and Landsat.

The USGS Landsat Analysis Ready Data (ARD) Program
Landsat data, referenced with WGS84 and provided as GeoTIFF, can be accessed from EarthExplorer for the contiguous US, Alaska, and Hawaii.

How This Remote Island Inhabited by Polar Bears Became Known as Landsat Island
A few unusual pixels in Landsat imagery led to the discovery of a previously unmapped island off the coast of Labrador, Canada.

3.1-Trillion Pixel Landsat 8 Mosaic of the World
Descartes Labs has compiled some of the massive amount of data sent back from the satellites orbiting Earth into a 3.1-trillion pixel composite image of Earth’s surface.