
Remote sensing, particularly from satellite, drone, and aircraft data, have increasingly transformed the types of information we are able to capture from large ecosystems.
Increasingly, scientists have been able to develop what are essential biodiversity variables (EBVs) derived from remote sensing data that can better tell us about the health of ecosystems as well as act as an early warning system to help ecosystems. With such information, we can better monitor and plan how to best conserve ecosystems.
The critical revolution in satellite and other remote sensing data include the fact that we now have many different types of sensors, particularly electromagnetic spectral and radar data from sensors, that enable a variety of important data to be captured.

Remote Sensing Helps to Fill in the Gap
Both active and passive sensors on remote sensing platforms are enabling us to capture data that, in some cases, did not exist only a few decades ago. We can now even use the data to distinguish types of plants and tree cover in forests.
Remote sensing platforms such as LANDSAT, ASTER, drones equipped with thermal and spectral cameras, and even synthetic aperture radar (SAR)-based systems are helping to revolutionize the types of data we can capture.
By using satellite, airplane, and drone data, we are also better able to capture varying resolutions, from individual trees to larger ecosystems. Such data used together help fill in critical gaps in our knowledge about ecosystem health and provide recurrent data to continually monitor how ecologies evolve.
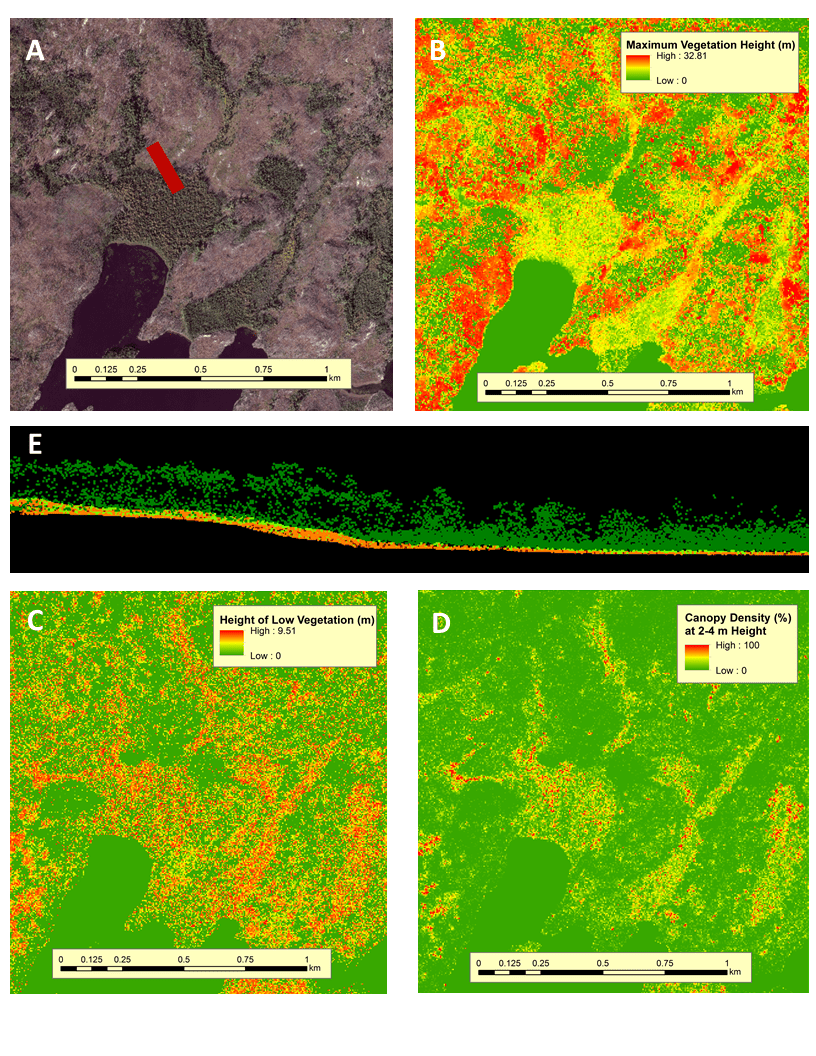
Based on these types of data and imagery, we can now better estimate regions such as forests for their overall health. For instance, types of species, canopy height, overall tree diversity, land cover variability, and photosynthesis activity are all be better measured and understood today than they were even ten years ago.
Using data captured from satellites and other remote sensing sources, researchers could also feed information to models that better estimate how forests and ecosystems evolve and these help to forecast how ecosystem health will change.[1]
Monitoring Ecosystems with Remote Sensing
Why remote sensing has become critical is because scientists find themselves in a race against time and capturing wide data from remote sensing enables a better way to monitor ecosystems.
For instance, individual tree species could be better understood, including distribution of native or invasive species, using visible, near-infrared, short-wave infrared data from electromagnetic cameras.
Radar can inform on canopy height for trees, which is an important variable for overall health in actively growing forests. Community diversity in a given ecosystem can be better captured by spectral cameras that inform on plant chlorophyll levels, demonstrating if diversity represents a healthy mixture of native plants across wide areas.
Disturbances, such as from fires, are now also more easily monitored, including how these disturbances affect and lead to recovery in forests or other ecosystems. For instance, after a forest fire, the ability for a forest to grow back and for native species to take hold could be better monitored using satellites such as Sentinel-2.
With EBVs better captured using remote sensing, scientists now see that remote sensing forms among the most critical data used in forecasting how ecosystems may change or might be affect by climate change and other environmental disturbances.
Overall, there are 20 EBVs that researchers have categorised, with six spatial scales that range from the DNA level to large-scale ecosystems. Currently, remote sensing is able to capture two of these scales efficiently, but researchers are trying to develop better ways to use remote sensing to capture all or more of the other scales.
Among current topics of research, scientists are actively trying to use drones or other remotely sensed platforms to find spectral or other signatures that may inform on DNA structure for plants.[2]
Fieldwork is still critical to scientists, particularly to validate observations. In regions such as the arctic tundra, wetlands, and a temperate forest, fieldwork is used to collect data to demonstrate that satellite spectral data can be used to create EBVs that enable an early warning system on health of ecosystems.
In other words, even before ecosystems appear unhealthy, satellite data can provide early warning for scientists to intervene in given ecosystems. Researchers are recommending that biodiversity observation networks, with remote sensing being a critical component, be setup in countries so that they can better monitor and respond to the health of ecosystems well before problems are evident.
Remote sensing should form an active component in how countries develop policies around their ecosystems.[3]
The challenge in coming years will be to increase the spatial variability that can be observed in remote sensing data while improving how such data are translated to actionable variables. This will include improving modeling that derives from remote sensing data, while also improving the types of data captured, including levels down to DNA or molecular structures of plants.
We are still some way before attaining that level but scientists are hopeful that this will be achievable in the years to come and better links between policy can be established between remotely sensed data and measures to protect ecosystems.
References
[1] For more on a story on using remote sensing to learn about ecosystems and EBVs, see: https://www.science.org/content/article/satellites-offer-new-ways-study-ecosystems-maybe-even-save-them.
[2] For more on important EBVs and how remote sensing can capture them can be seen here: Alleaume, S.; Dusseux, P.; Thierion, V.; Commagnac, L.; Laventure, S.; Lang, M.; Féret, J.; Hubert‐Moy, L.; Luque, S. A Generic Remote Sensing Approach to Derive Operational Essential Biodiversity Variables (EBVs) for Conservation Planning. Methods Ecol Evol 2018, 9, 1822–1836, doi:10.1111/2041-210X.13033.
[3] For more on remote sensing data over the last 15-20 years and how it has shaped EBVs, see: Remote Sensing of Plant Biodiversity; Cavender-Bares, J., Gamon, J.A., Townsend, P.A., Eds.; Springer: Cham, 2020; ISBN 978-3-030-33156-6.