
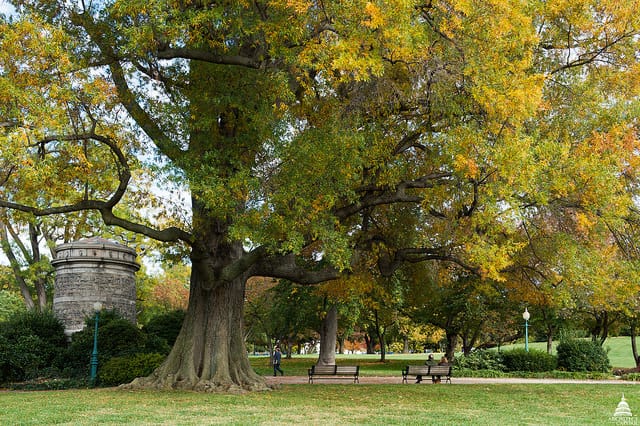
Urban vegetation provides numerous benefits. City trees are rightfully celebrated for their ability to create shade and reduce the urban heat island effect, stop airborne polluting particles and purify the air, and offset at least some of the carbon emissions by absorbing carbon dioxide.
Challenges in Monitoring Urban Vegetation
However, urban vegetation is notoriously burdensome for cities to keep track of. Manual tree studies – mostly done as individual tree surveys – can be costly for local governments in terms of time and money.
This becomes even more pronounced if we consider the fact that urban trees have short and unpredictable lifespans, which means that tree composition is ever-changing. Also, many trees in residential areas are on private properties and are exempt from public space tree counts – even though they too, impact the local climate.
Financial and Time Constraints: Manual tree surveys – mostly done as individual tree surveys – can be costly for local governments in terms of time and money.
Dynamic Tree Populations: Urban trees have short and unpredictable lifespans, which means that tree composition is ever-changing.
Private vs. Public Trees: Many trees in residential areas are on private properties and are exempt from public space tree counts, even though they too impact the local climate.
Impact of Outdated and Imprecise Tree Records
Many city councils and other decision-makers have to deal with outdated and imprecise tree records, making it hard for them to develop the best possible plans to maintain or enrich the community’s vegetation.
Google’s Tree Canopy Lab: An Innovative Solution
To help solve the problem, Google has launched a new product – the Tree Canopy Lab, now available for the city of Los Angeles. It is a part of the Environmental Insights Explorer platform.

In Tree Canopy Lab, the aerial imagery already used in Google Maps and Google Earth is now also utilized to estimate tree canopy coverage. The images are collected during the spring, summer, and fall. In addition to aerial imagery, the tool includes external public data* on heat risk, population density, and neighborhood boundaries – all accessible as map overlays.
Capabilities of the Tree Canopy Lab
As the name suggests, the Tree Canopy Lab enables the user to analyze tree coverage in a given area – for now, that would be within Los Angeles’s boundaries only; however, the official Google Blog states that hundreds of other cities are going to be covered in 2021. The inclusion of other data makes it possible to make more complex assessments – such as comparing tree coverage by neighborhood, combining heat index and population density to identify certain vulnerabilities, and understanding land use and type distribution across neighborhoods.
How does Tree Canopy Lab work?
Tree Canopy Lab utilizes a special tree-detection AI to generate a vegetation probability model. It automatically analyzes images combined with 3D digital surface models and, when available, with near-infrared data. The trees are identified by data discrimination – any values that peak above a certain threshold are distinguished and classified as tree canopy. The estimates are then summarized and aggregated, thus providing a coverage estimate for each highlighted area. The final product is a map that shows the density of tree cover, or “tree canopy.”

User-Friendly Features of Tree Canopy Lab
As with other Google products, the tool is very user-friendly and aesthetically pleasing: for example, the clickable areas allow you get info on tree coverage, the average heat health index, and average population density in each area, and pre-calculated visualizations can be used to interpret how tree coverage correlates with heat and population density.
Intended Use of Tree Canopy Lab
Tree Canopy Lab is a valuable effort to fix the aforementioned data holes in urban tree studies. Anyone, from policymakers to scientists to citizens, can explore the LA vegetation and gain significant insights. Besides the mere quantification of tree cover, more information can be generated with the help of additional data – e.g., you can identify sidewalks that are vulnerable to high temperatures due to low canopy density (the Heat Heath Action Index – HHAI).

Hopefully, better data visibility will lead to a higher quality of decision making, eventually making urban spaces greener and better adapted to face – and alleviate – the effects of global warming.
The Broader Environmental Insights Explorer Platform
The entire Environmental Insights Explorer platform aims to provide city governments and organizations with tools to analyze environmentally-relevant data and plan for pollution and carbon emission reduction. By making this set of available tools, Google takes a step forward to follow up on its commitment to help local governments mitigate climate change.
*The public data comes from the following sources: City of Los Angeles Boundary Data, City of Los Angeles Land Use, EnviroAtlas, the California Heat Assessment Tool, and CIESIN at Columbia University.
Resources
Labs: Tree Canopy: https://insights.sustainability.google/labs/treecanopy
“Creating new tree shade with the power of AI and aerial imagery”. Google Blog. 18 November 2020
“Cities: where climate action can have the most impact”. Google Blog. 14 September 2020.
Google Environmental Insights Explorer: https://insights.sustainability.google/