
Spatial Analysis
The spatial analysis category looks at data manipulation techniques in GIS.

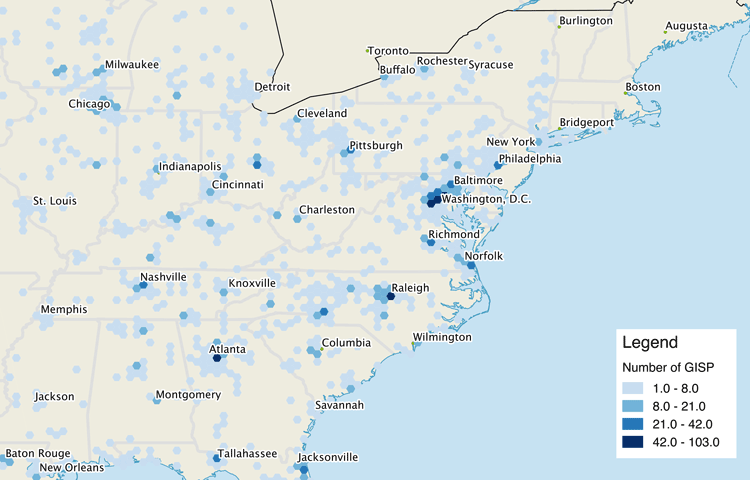
How to Create a Radial Flow Map Using QGIS
Learn how to create a radial flow map in QGIS to visualize migration using metro-to-metro data from the U.S. Census Bureau.
Using QGIS to Create a Hexbin Map
It is fairly easy to create a hexbin map using QGIS by following this GIS tutorial.

The Coastline Paradox: Why Measuring Coastlines isn’t that Simple
The coastline paradox is the concept that the measured length of a coastline will change depending on the scale of the GIS data used for the measurement.

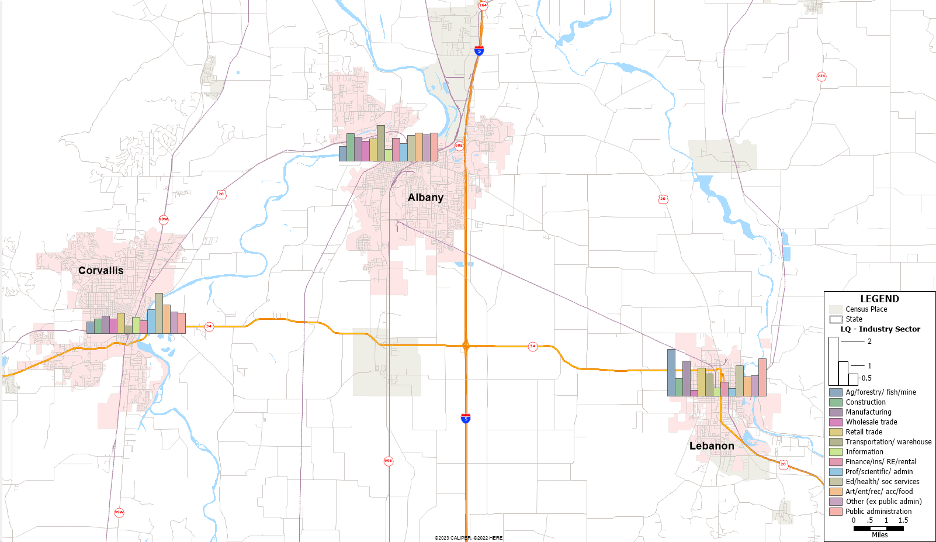
Using GIS to Map Trends in Employment
This tutorials shows users how to analyze ACS data from the US Census Bureau to calculate employment shift-share and location quotient using Maptitude.
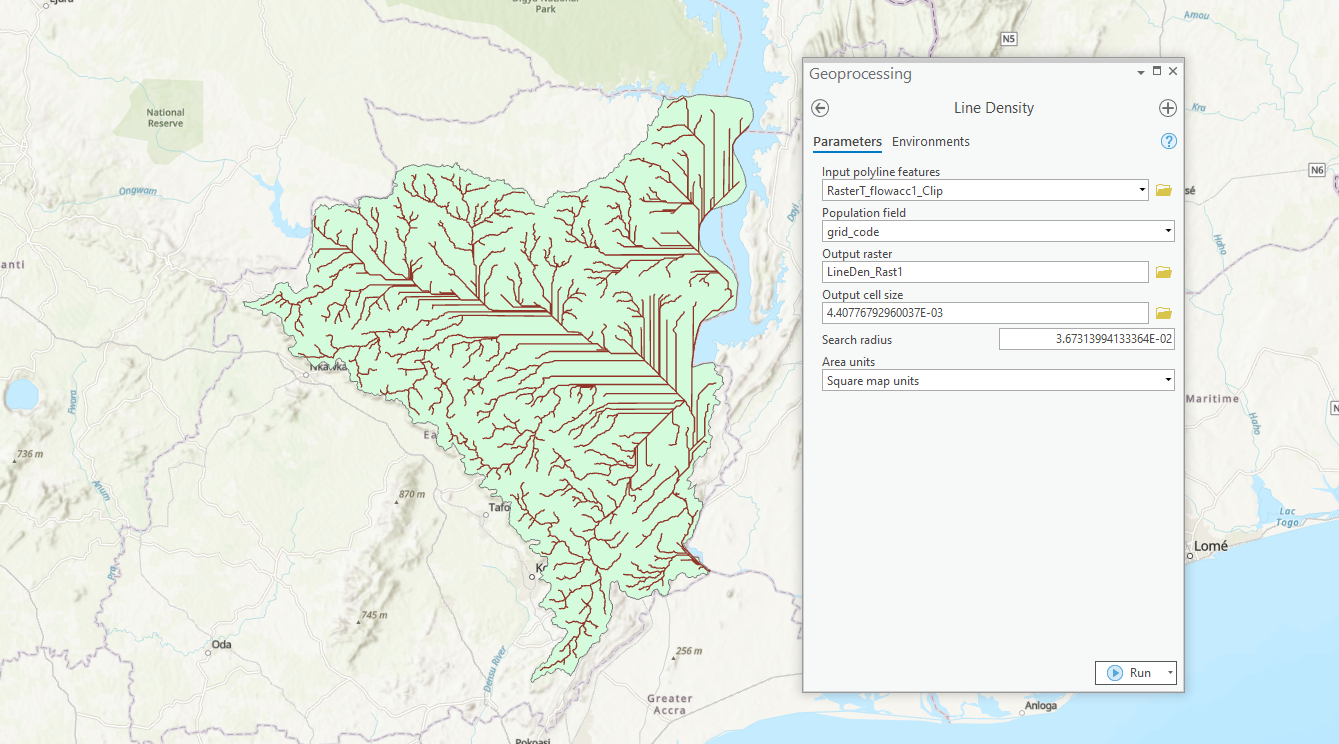
How to Map Watersheds Using ArcGIS Pro: A Step-by-Step Guide
This tutorial shows you how to use ArcGIS Pro to delineate watersheds and drainage paths from elevation data.

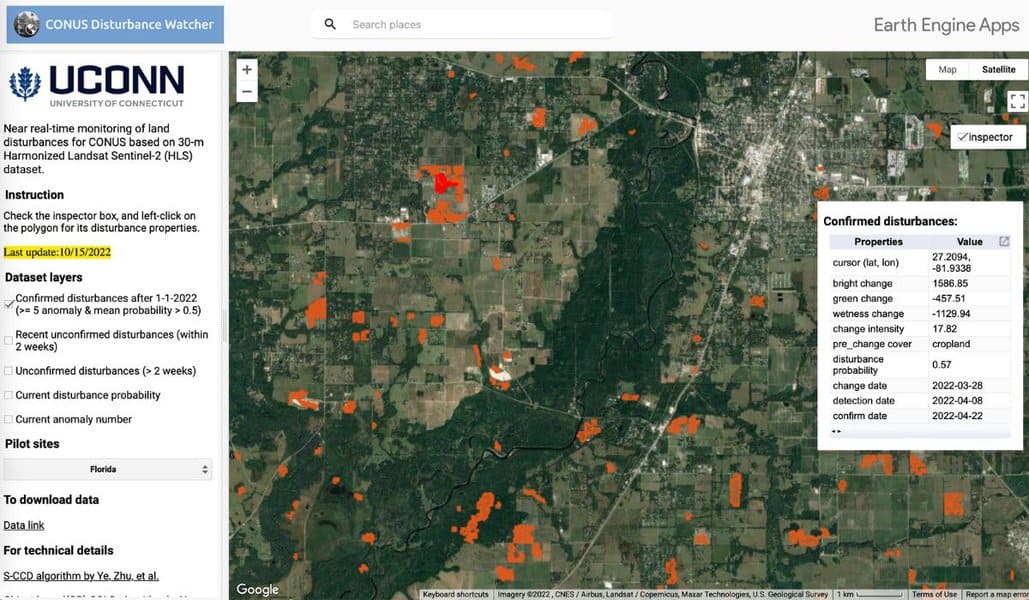
Forecasting Wildfire Behavior: Earth Observation and GIS
Advances in GIS, remote sensing, and machine learning are leveraging land and weather data to improve fire prediction models.
Basic Uses of GIS
What are the basic uses of GIS? This article reviews some of the most common and basic users of GIS including mapping data, proximity analysis, buffers, cluster mapping, and querying a geographic area for features.

Mapping Tornado Tracks with Satellite Data
Researchers used satellite imagery and remote sensing to map tornado tracks.
Using Geospatial Technologies to Map Hurricane Response
Using satellite data and artificial intelligence, researchers have developed a way to rapidly map hurricane destruction.

GIS and Spatial Interpolation Methods
The use of spatial interpolation methods in GIS have proven vital from areas such as public health to interpreting weather patterns.

Heat Maps in GIS
Heat mapping, from a GIS perspective, is a method of showing the geographic clustering of a phenomenon.
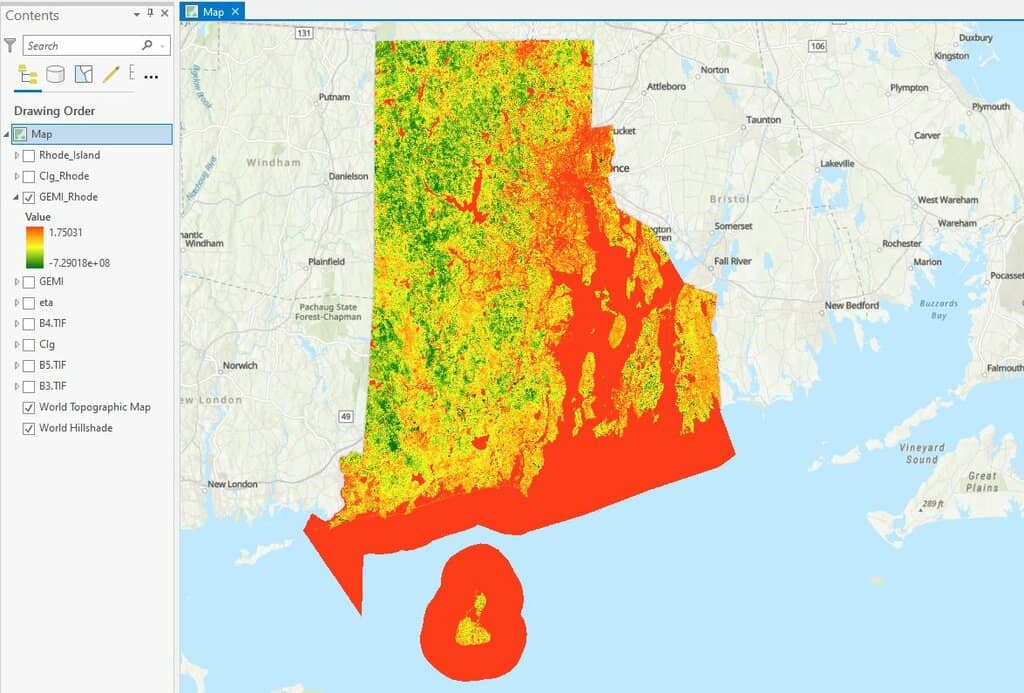
How to use ArcGIS Pro and Landsat 8 Imagery to Calculate Chlorophyll Index and Global Environmental Monitoring Index
Learn to create a chlorophyll index using Landsat 8 imagery in ArcGIS Pro with this step-by-step GIS tutorial.

Finding GIS Data and Using QGIS to Map Caves
Dackery Geiman outlines the challenges he encountered finding geospatial data about caves and using QGIS to map cave density in Missouri.

GIS in Land Use Planning and Surveying
Michael Parks explains how he used GIS data and imagery to develop geospatial analysis and maps to recommend potential base camp sites.

Mapping Oil Slicks With Satellite Imagery
Sentinel-1 synthetic aperture radar (SAR) satellite data has been used in a study to map oil slicks.

Reliability of Machine Learning Maps
Academics are increasingly adopting machine learning maps to better understand what can happen for a range of environmental events.

Higher Resolution U.S. Flood Maps
Researchers have developed a high resolution flood map for the United States.

Mapping the Sounds of the Ocean
Using hydrophones, scientists convert sound waves to electrical signals to create images of underwater ocean environments.

Extracting Geospatial Data from Historical Maps
Geospatial methods can detect location names from historical maps, make them searchable, and allow for the automated extraction of geographic data from those maps.

How to Use ArcGIS Pro to Estimate Soil Erosion from a Catchment Basin
This lesson shows how to use spatial data science and remote sensing techniques in ArcGIS Pro to predict soil erosion in a catchment area using the Universal Soil Loss Equation (USLE).

Remote Sensing of Lightning
Satellites and remote sensing tools are providing a way to better forecast and determine the severity of lightning.

How to Use ArcGIS Pro for Fire Risk Mapping
Tutorial showing how to map fire risk for a region with slope, elevation, aspect, and land use data in ArcGIS Pro.
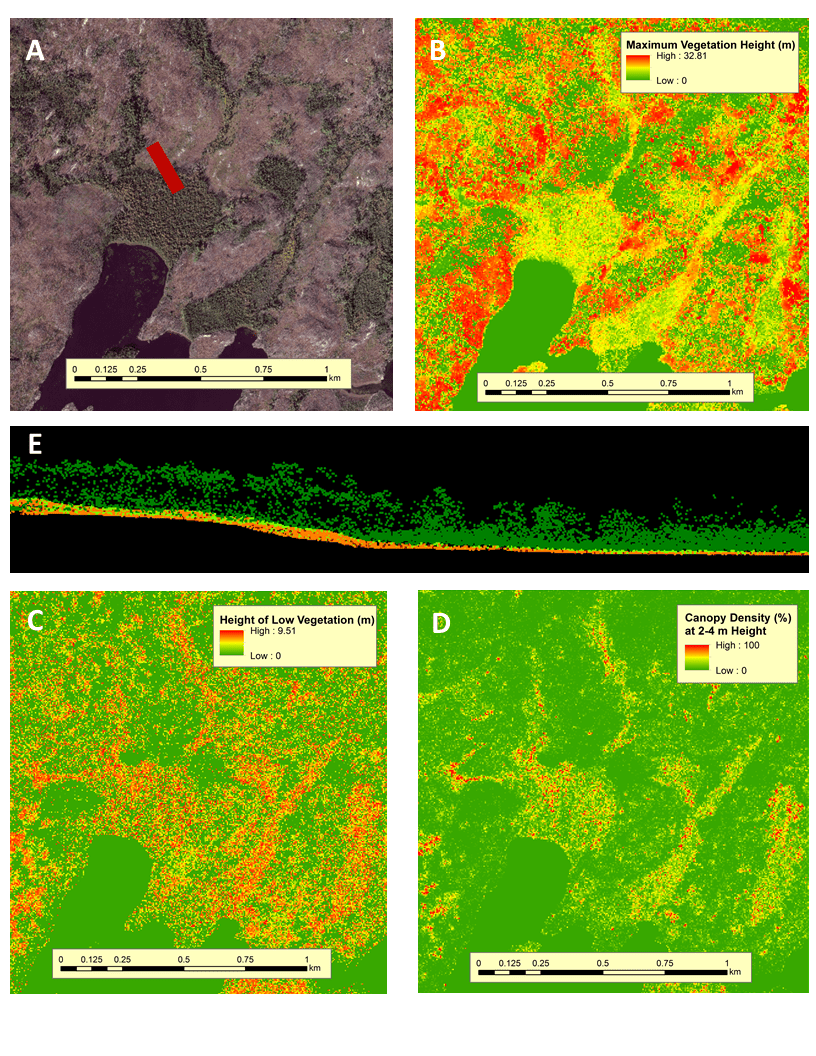
Mapping Ecosystem Health through Satellite Data
Remote sensing techniques, particularly those based on satellite, drone, and aircraft data, have revolutionized collecting ecosystem data.
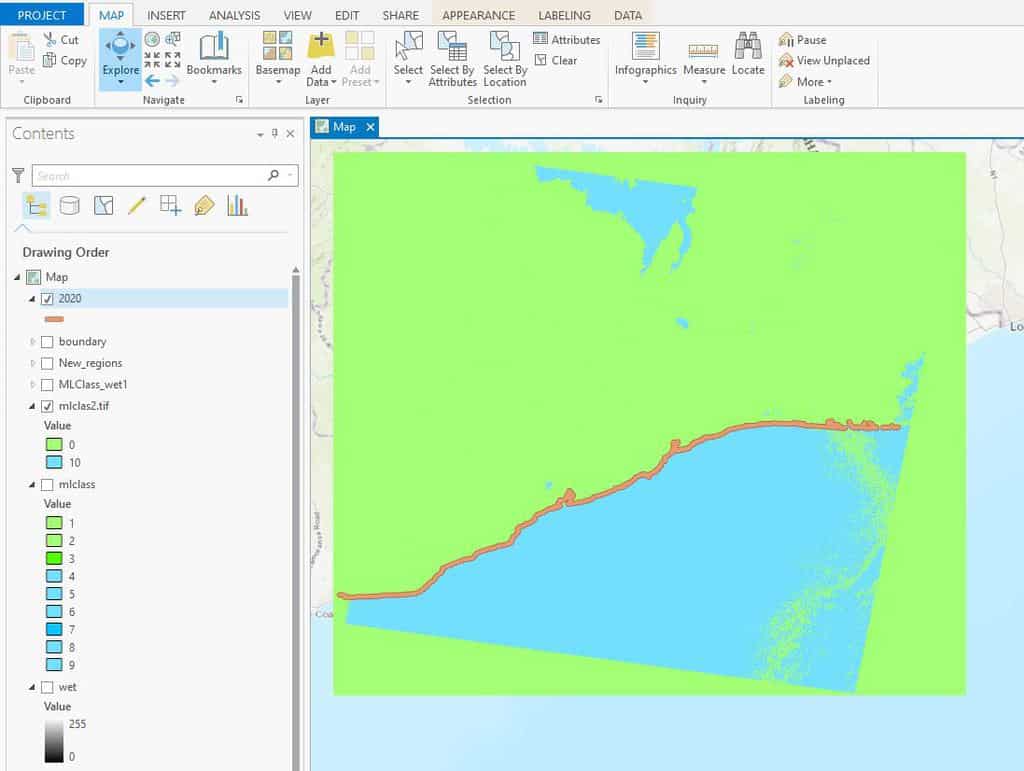
How to Use ArcGIS Pro for Automatic Shoreline Delineation from Landsat Imagery
Learn how to extract shorelines in ArcGIS Pro using the Tasseled Cap and NDVI indices with the Landsat toolkit for automatic shoreline delineation.

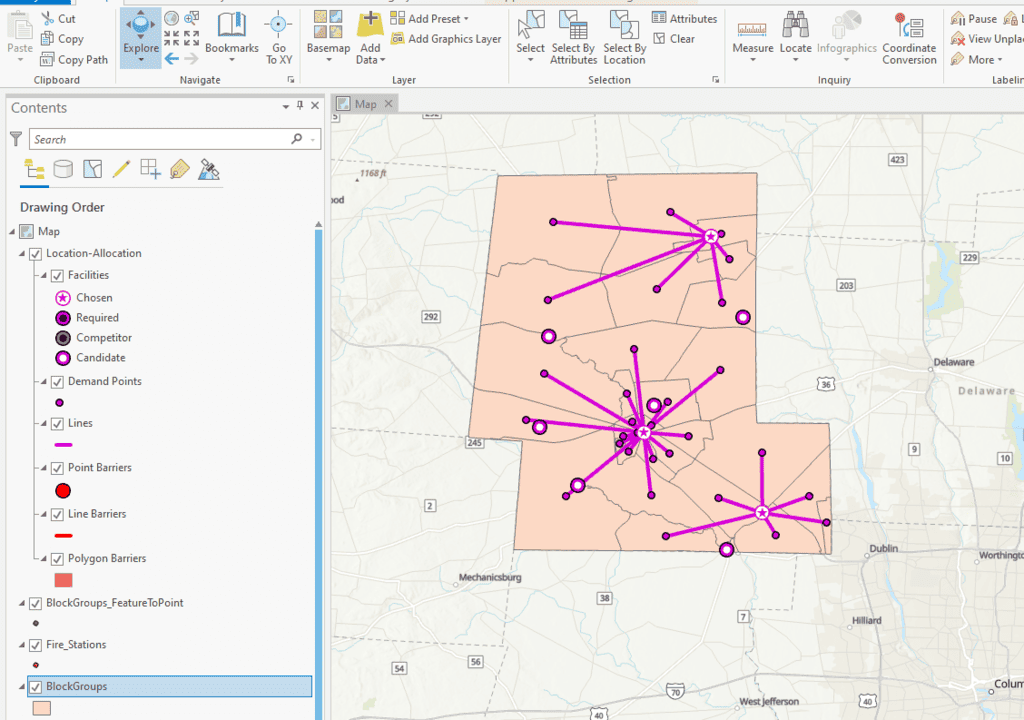
How to Perform a Site Selection Analysis in ArcGIS Pro
Using this tutorial, ArcGIS Pro users will learn how to do a site selection analysis, which includes analyzing travel times and accessibility to a location via various modes of transportation.