Binning is a cartographic technique for showing the density of point features. Binning involves overlaying a grid of uniform shapes onto a point dataset. Each cell in the grid is then assigned the number of points that falls within it. A graduated color classification is then used to show visually which cells contain the largest number of points. Different sized shapes can be used such as rectangles, diamonds, and hexagons.
What is a hexbin map?
A hexbin map is the concatenated term for “hexagonal binning”. This involves the use of hexagons as the bin shape. It is fairly easy to create a hexbin map using QGIS. This GIS tutorial uses a geocoded database from the GISP Registry provided by the GIS Certification Institute (GISCI) in 2017. The database was geocoded based on the ZIP code listed for each registration.
Creating a Hexbin Map with QGIS
To get started with creating the bin map, the first step is to install the MMQGIS plugin which provides a lot of very handy functions. You will need this plugin to create the hexagon grid layer. To install go to Plugins –> Manage and Install Plugins…
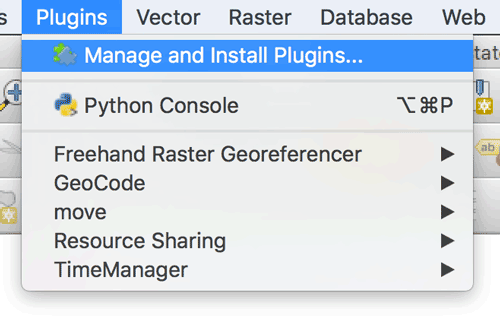
In the GUI, search for MMQGIS, click on the plugin and select install plugin.
Load in the Point Shapefile
Before you create the grid, you will need to load in the point shapefile. As I mentioned, this example uses a geocoded GISP shapefile as the point layer. Once the layer is loaded, it is time to create the grid.
Create a Hexagon Grid
To create the hexagon grid, go to MMQGIS –> Create –> Create Grid Layer.
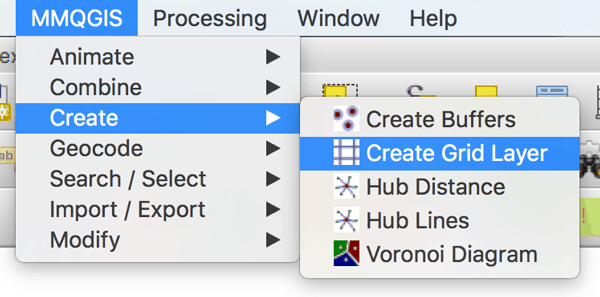
In the Grid GUI that pops up, select the “Shape Type” from the drop down as “Hexagons”.
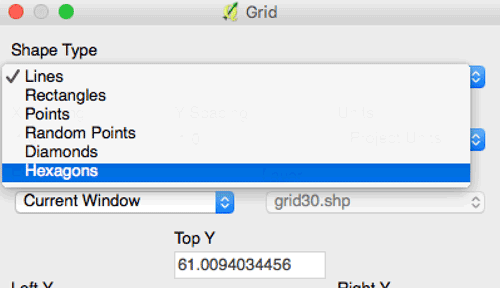
Set the resolution of the hexagon grid
Next, you want to set the resolution of the grids. The larger the X spacing you enter, the larger the individual hexagon shapes will be in the grid. I wanted a very small hexagons so I entered 0.25 as the x value. I left the units as the default project units.
Then select the extent of the grid. It can be the current extent which is useful if you only want the grid to cover a zoomed in area. I set it to the extent of my point layer file.
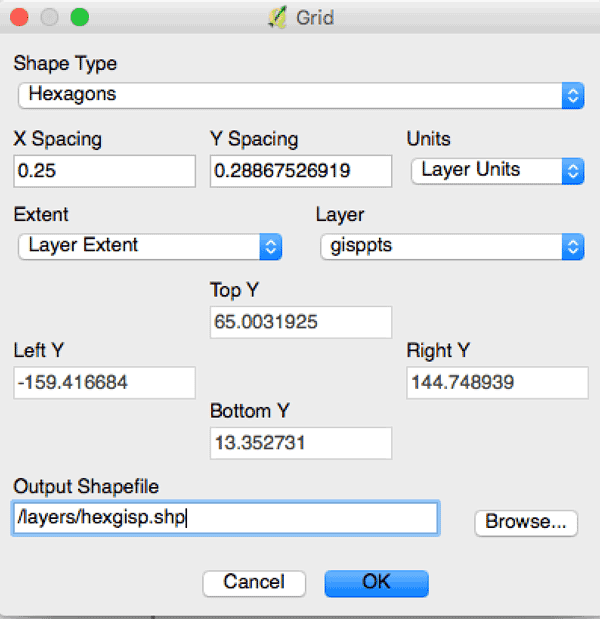
Last, choose the name and location of the new grid layer. Once your parameters are set, click on the “OK” button to generate the new grid layer.
Counting Points in Polygons
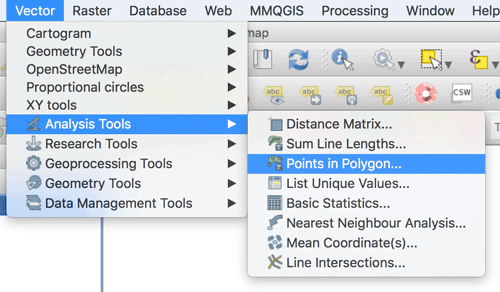
The next step in creating the hexbin map is to assign the number of points that falls within each hexagon. To do this go to Vector –> Analysis Tools –> Points in Polygon
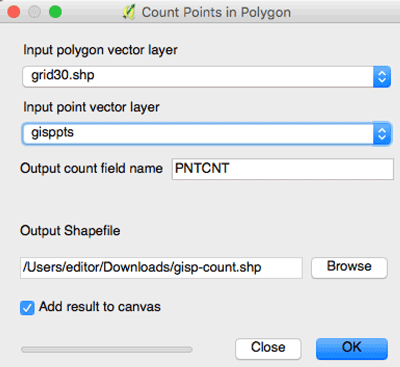
In the Count Points in Polygon GUI select the grid layer you just created and then the point layer. You can either accept the default count field name of “PNTCNT” or type in the name of the field that you want.
Finally, set the name and location of the new grid layer containing the count of points per polygon. Click on “OK” and a new layer will be added to the canvas. You might see a notice: “Warning: Input layers have non-matching CRS. This may cause unexpected results.” You can click OK and ignore this warning.
Finalizing the Hexbin Map
Now it’s time to symbolized the hexagon grid. To do so, right click on the layer and select the properties menu option.
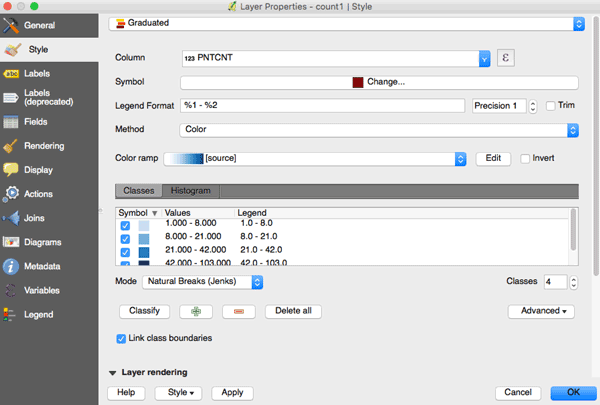
Select the Style menu option and then select “Graduated” Select the column containing the point in polygon counts. You can then select the color ramp colors and mode of breaks. Hit the classify button to see the values. To only show the cells that have a polygon count of 1 or more, adjust the first value groupings to start at 1.000.
Click on OK to symbolize your layer:

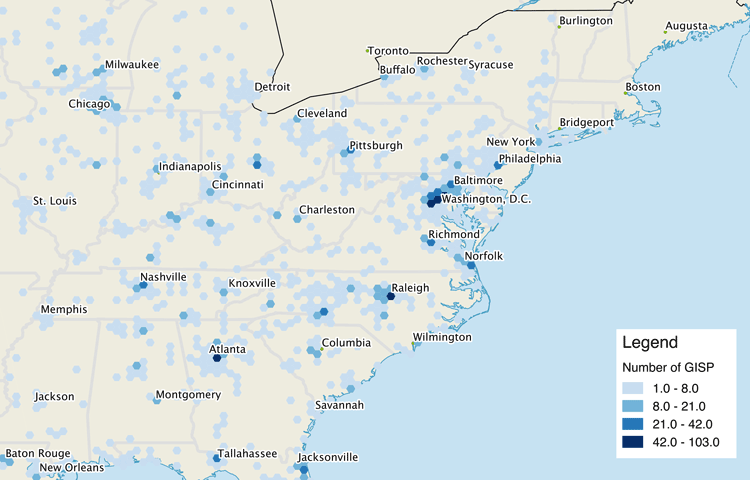
You now have a layer that shows point density as a hexbin map. The darker the blue, the more the points in within that hexagon.
Next add additional base layers to stylize the map view. Viewing a zoomed in area of the map shows where the clusters of GISP registrations are in this area of the United States.
This article was originally written on February 21, 2017 and has since been updated.
