In hydrology and GIS, delineating watersheds and mapping drainage densities are essential tools for understanding the movement of water across the landscape. Understanding water flow has far-reaching implications for water resource management, environmental conservation, infrastructure development, and disaster mitigation.
Mapping water behavior across a landscape is a key aspect of developing sustainable land use practices and the responsible management of Earth’s valuable water resources. This tutorial explains how to use GIS/Remote Sensing methodologies using ArcGIS Pro to delineate watershed and drainage network from DEM to create a drainage density map.
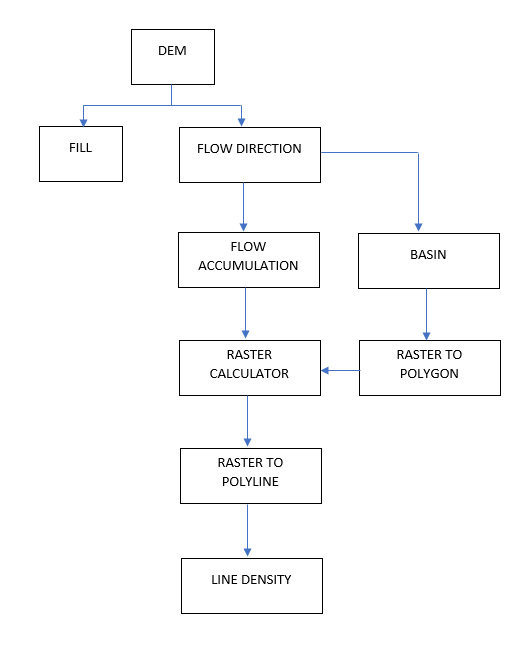
The geoprocessing tools used in this GIS tutorial are as follows: fill, flow direction, flow accumulation, raster calculator, basin, line density, raster to polyline and raster to polygon. Figure 1 shows a summary of the methodological flow employed in the study to delineate watershed and drainage network from DEM as well as create a drainage density map.
Accessing and importing DEM data
DEMs (digital elevation models) can be retrieved from United States Geological Survey (USGS)’s EarthExplorer website after a free sign up.
DEMs can also be derived by combining tools from Google Earth Pro and GPS visualizer’s website. To do this:
- Open Google Earth Pro.
- From the “Places” tab, right-click on “Temporary places” to create a new folder (working directory).
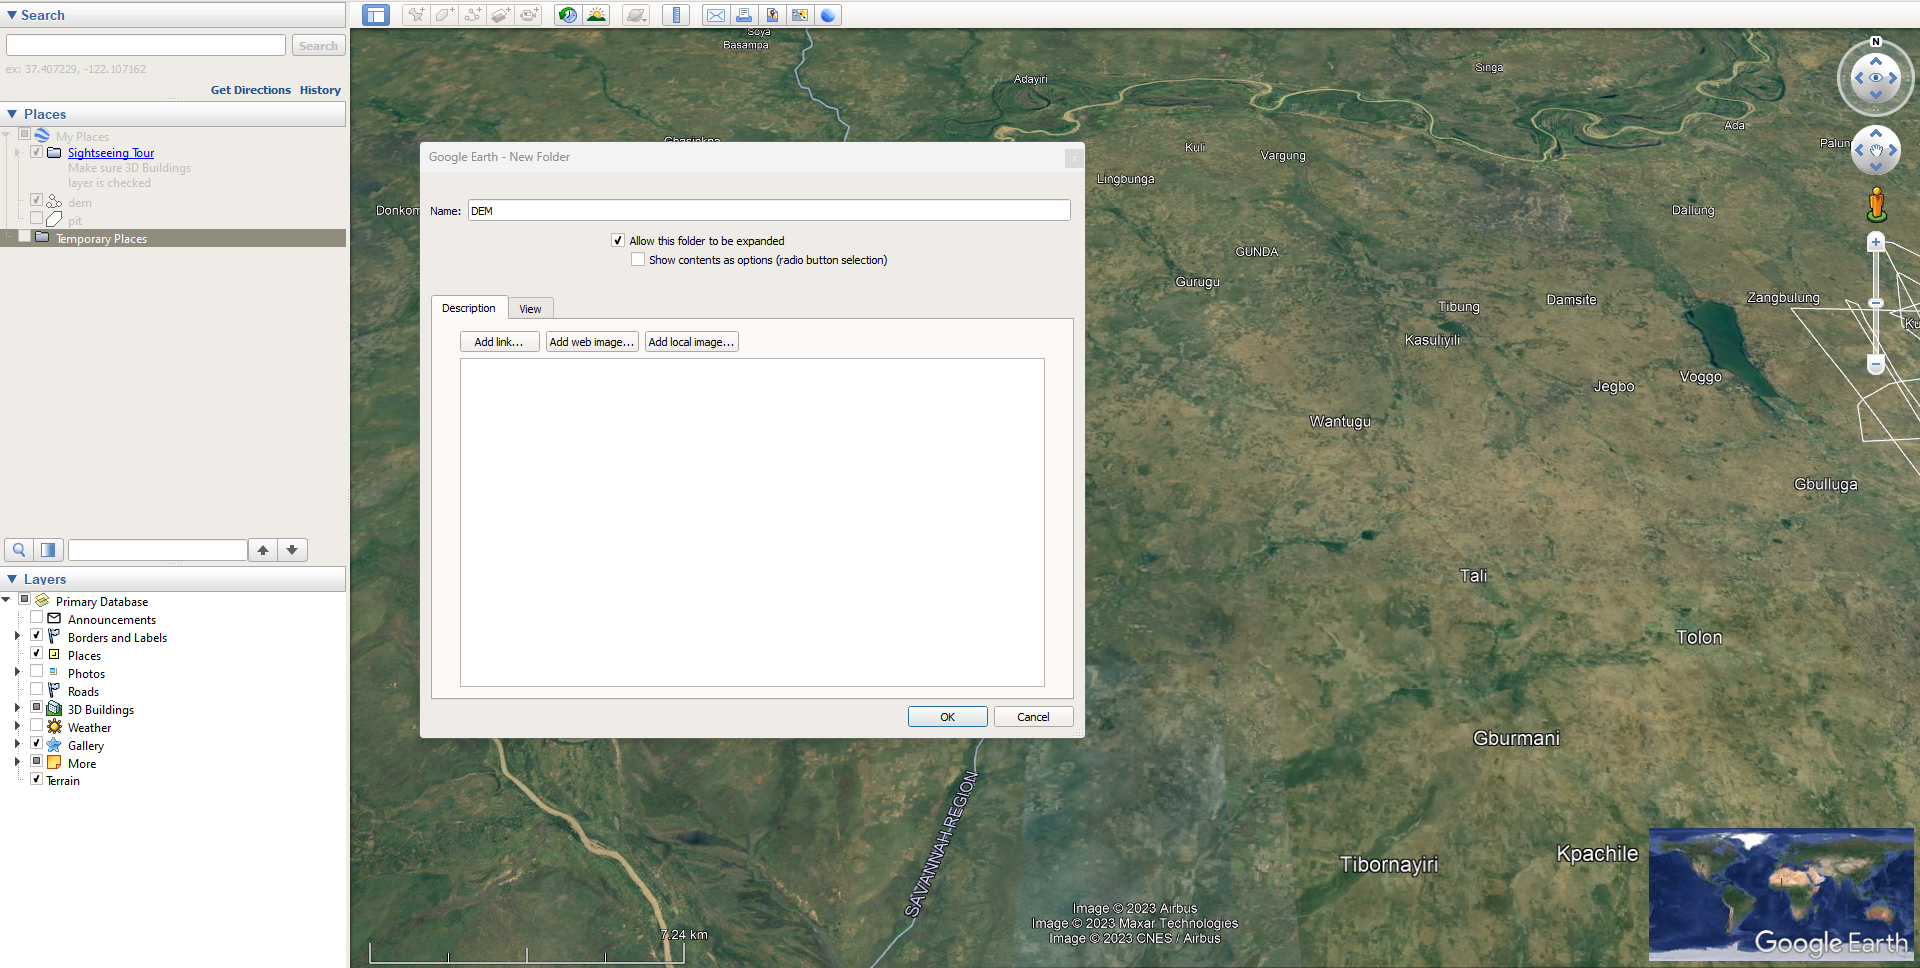
- Select “Add Path” from the tool icons above the visualization pane.
- Draw random lines to cover the study area.
- Specify a name for the digitized lines.
- Click Ok.
- To save the work done, right-click on the working folder and select “save place as.”
- Specify desired output name and location.
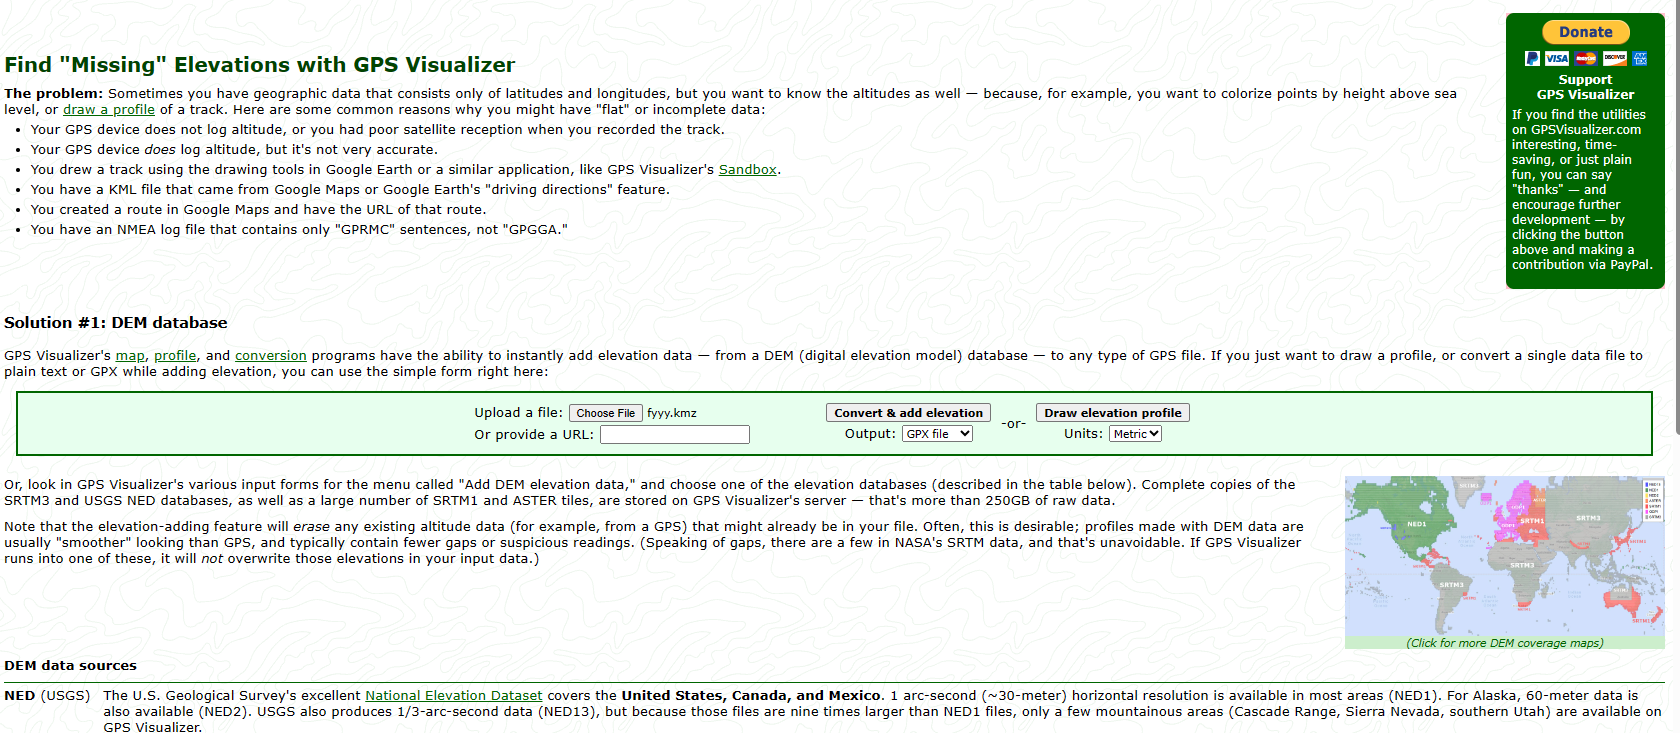
- Open GPS Visualizer’s website.
- Set input to output file from google earth.
- Select “convert and add elevation.”
- Export the output file in .gpx format.
To import and process the gpx file in ArcGIS Pro:
- Open and Create a new project in ArcGIS Pro.
- From the search bar of the geoprocessing toolbox, select “gpx to features.”
- Set input to gpx file.
- Set “output feature class” to desired output name and location.
- Click Run.
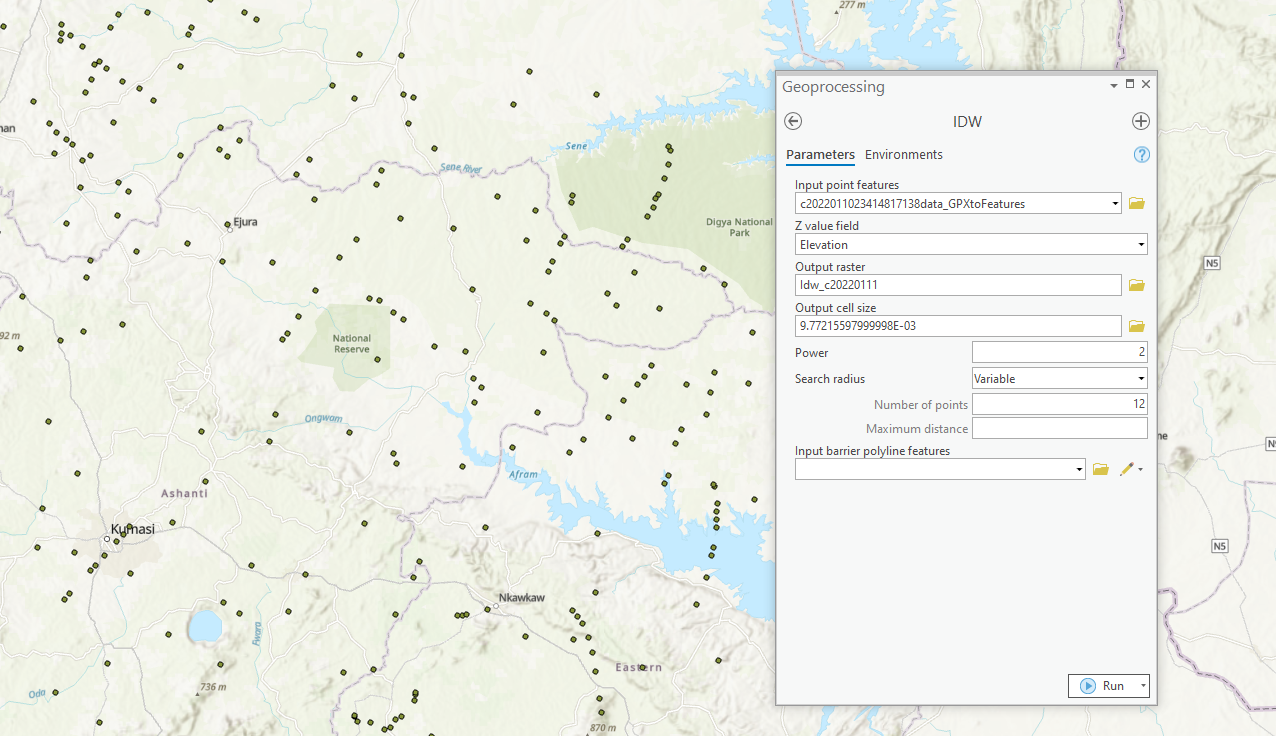
- From the search bar of the geoprocessing toolbox, type and search “IDW.”
- Set “input point features” to the output feature file.
- Set “Z value field” to elevation.
- Set “Output raster” to desired output name and location.
- Click Run.
Extracting watershed and drainage from elevation data in ArcGIS Pro
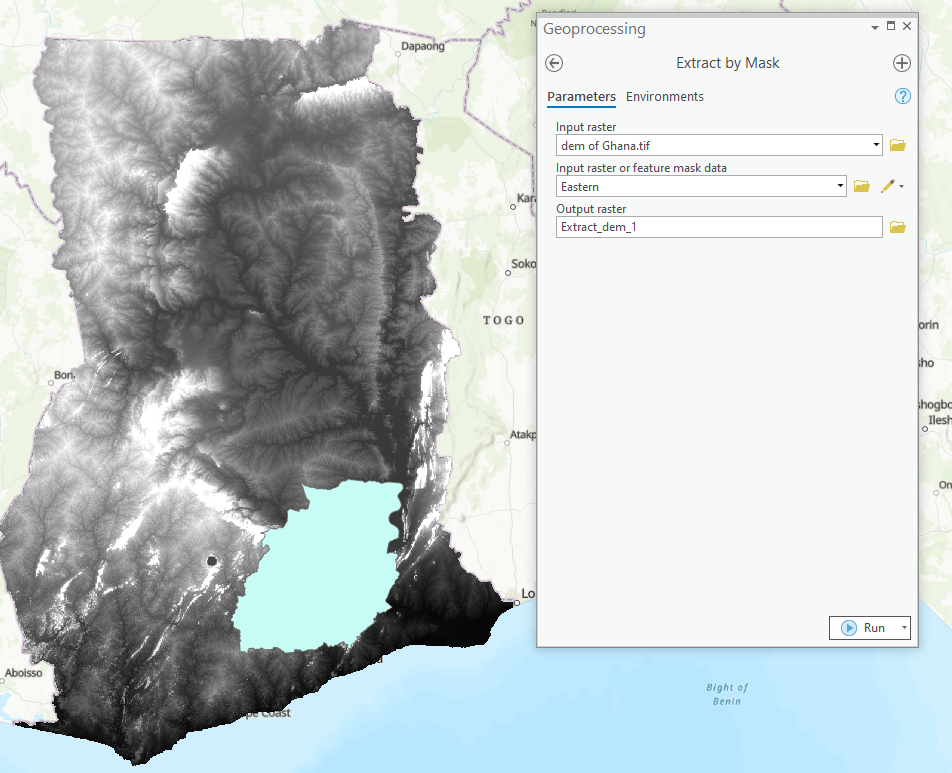
If the DEM you have extends over a large geographic area than necessary, you can use the “clip” or “extract by mask” tool to create an elevation dataset for just your area of interest.
To use the “extract by mask” tool:
- Type and search “Extract by mask” from the search bar.
- Set input raster to downloaded DEM data.
- Set feature mask data to region of interest.
- Set output raster to desired output name and location.
- Click Run.
To extract watershed or basin from DEM in ArcGIS Pro:
- Type and search fill from the search bar of the geoprocessing toolbox.
- From the Fill window, set “input surface raster” to DEM.
- Set “Output surface raster” to desired output name and location.
- Click Run.
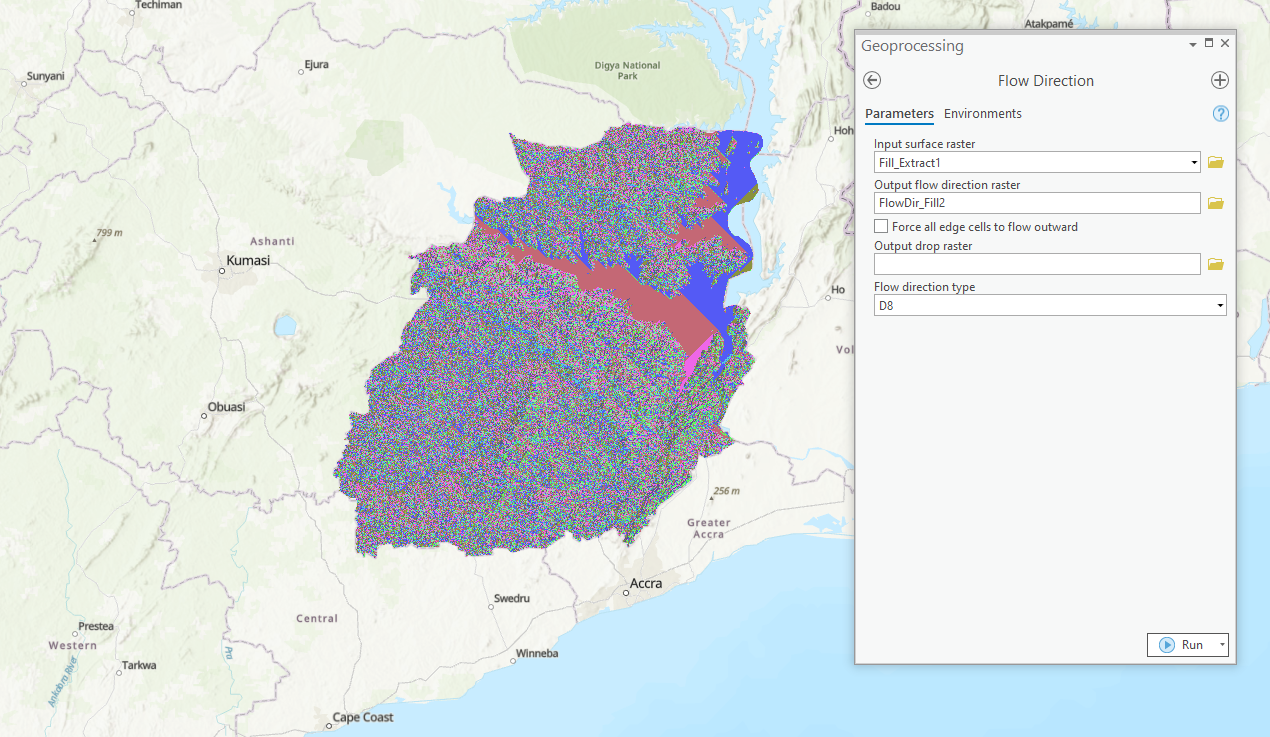
- After using the Fill tool, type and search flow direction from the search bar.
- Set “input surface raster” to Fill_DEM (results derived from using the fill tool).
- Set “output flow direction raster” to desired output name and location.
- Click Run.
- Type and search “Basin” from the search bar of the geoprocessing toolbox.
- Set “input D8 flow direction raster” to output of the flow direction process.
- Be sure to set output raster to desired name and location of output file.
- Click Run.
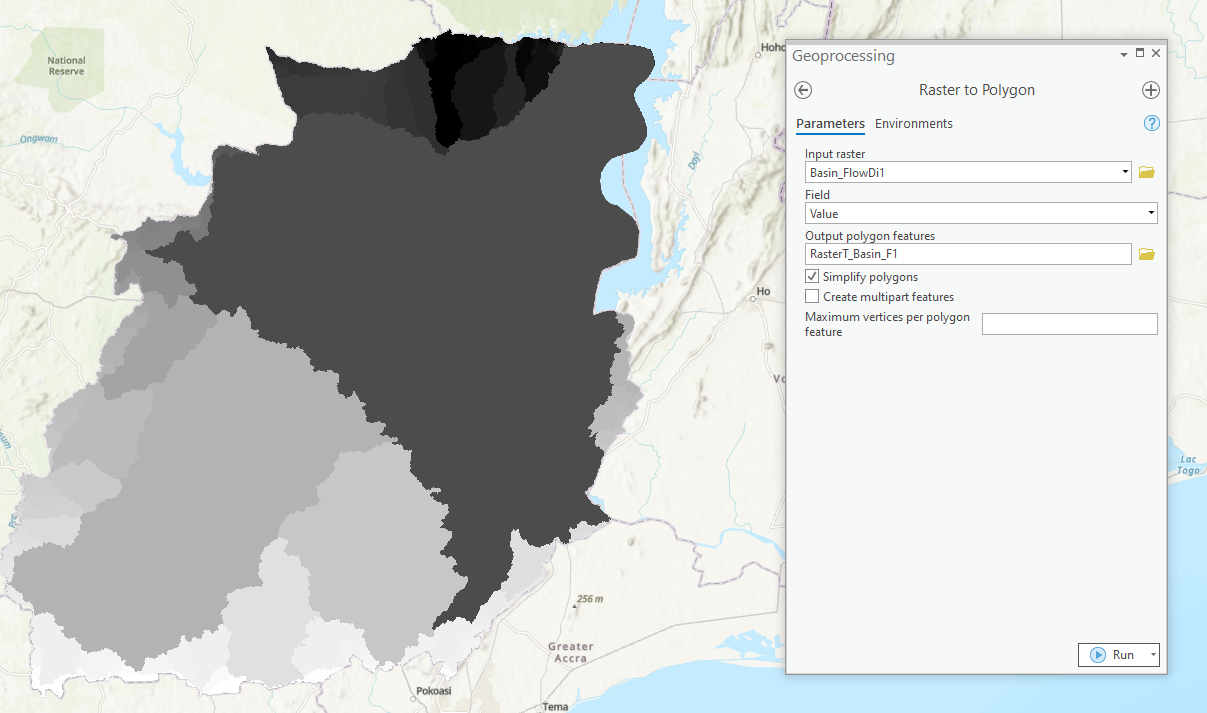
Basins or watersheds generated to cover the study area are in the raster format. Use the “raster to polygon” tool to “vectorize” the watersheds;
- Type and search raster to polygon from the search bar.
- Set input raster to the watershed raster file.
- Set output polygon features to desired output name and location.
- Click Run.
Drainage network for the study area is generated from the flow accumulation raster. To accomplish this:
- Type and search flow accumulation from the search bar.
- Ensure that the input becomes output of flow direction process.
- Set “Output Accumulation Raster” to desired output name and location.
- Click Run.
- Once the flow accumulation process is completed, select “Raster Calculator” from the “Spatial Analyst tools” of the geoprocessing toolbox.
- From the calculation bar, select “flow accumulation>1000.”
- Click Run
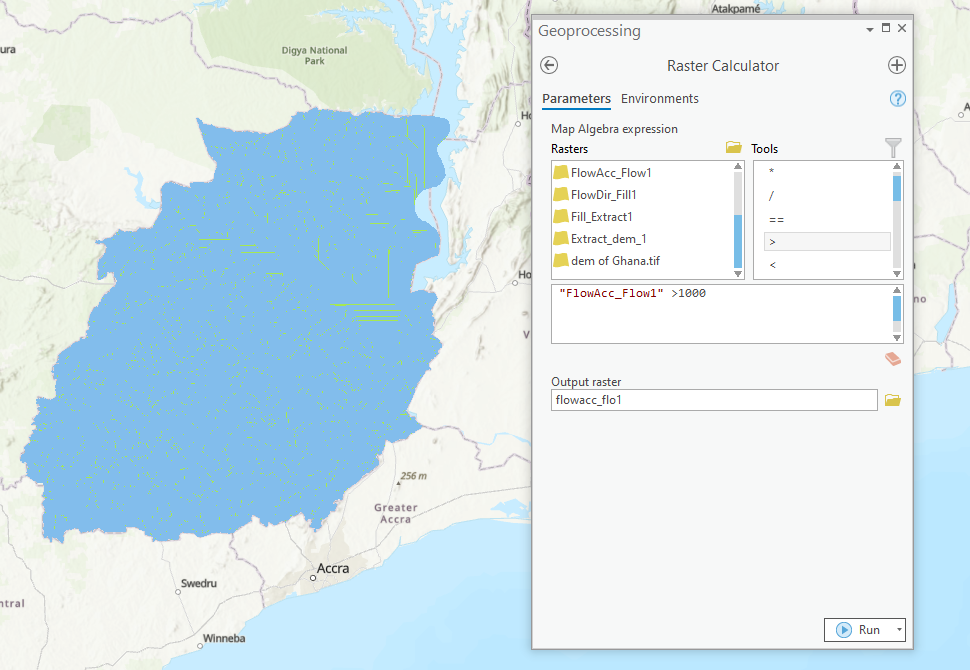
The drainage network is generated for the study area according to the level of detail specified during the calculation in the raster calculator. However, the drainage network appears in raster format. The “Raster to polyline” tool is used to “vectorize” the drainage network. To run through the vectorization process, follow the steps outlined;
- Type and search “Raster to polyline” from the search bar of the geoprocessing toolbox.
- Set input raster to drainage network (raster file).
- Set output raster to desired output name and location.
- Click Run.
Creating a drainage density map in ArcGIS pro
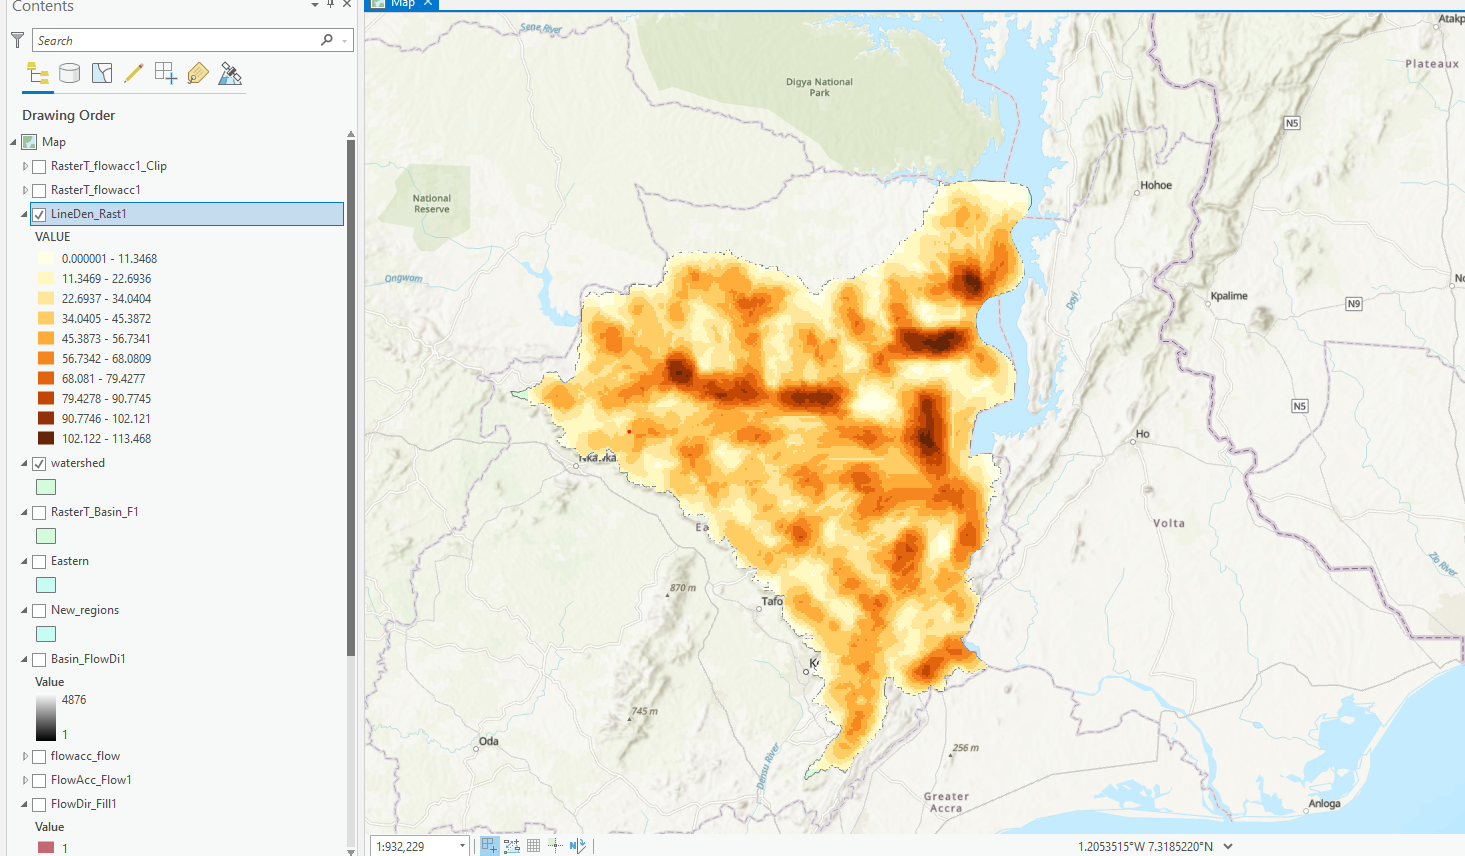
To create a drainage density map from the density network generated:
- Type and search “Line Density” from the search bar of the geoprocessing toolbox.
- Set input polyline features to generated drainage network.
- Set Population field to grid_code.
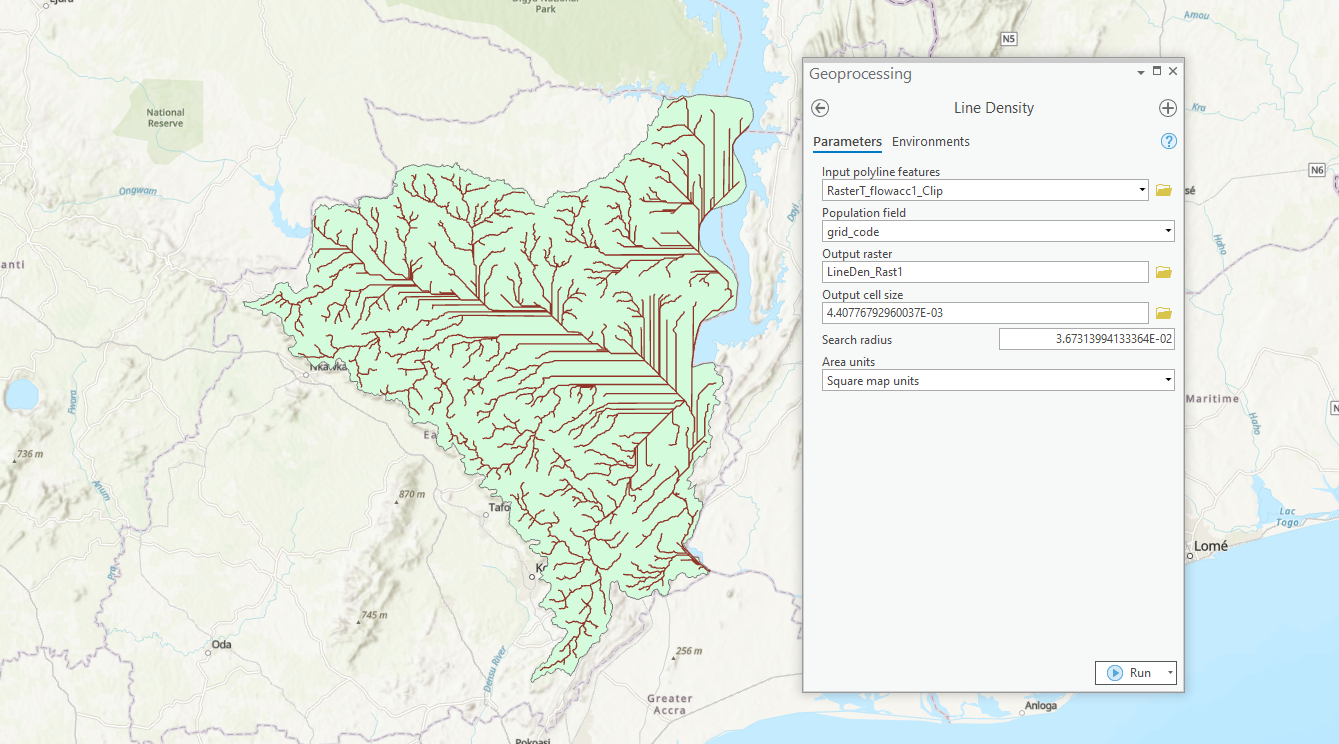
- Set output raster to desired out name and location.
- Click Run.
More ArcGIS pro tutorials
- How to Use the Suitability Modeler in ArcGIS Pro
- How to Perform Location Allocation Analysis in ArcGIS Pro
- How to Use ArcGIS Pro to Determine the Population Impacted by Air Pollution
- How to use ArcGIS Pro and Landsat 8 Imagery to Calculate Chlorophyll Index and Global Environmental Monitoring Index
- How to Use ArcGIS Pro to Estimate Soil Erosion from a Catchment Basin
