The ArcGIS Pro Network Analyst toolbar promotes the transport of goods and services efficiently by intelligent transport network analysis. The Analyst extension brings proactive planning and strategizing of vehicle movement and routing to reduce congestion and optimize the delivery of goods and services.
The Network Analyst extension is made up of problem-solving algorithms like Location Allocation, Service Area, Route, Closest Facility, Origin-Destination Cost Matrix, and Vehicle Routing problem.
For this tutorial, the Service Area and Location Allocation algorithms are explored.
Service area and location allocation algorithms in ArcGIS Pro
The service area algorithm helps to find service areas or catchment areas around any location on a network.
What is location allocation?
The location location algorithm also helps to determine from a set of facilities which facilities are best suited for operation based on potential interaction with demand points.
Location allocation in ArcGIS is a problem-solving approach for determining the best location for facilities, based on potential demand and the relative cost of delivering to or servicing that demand.
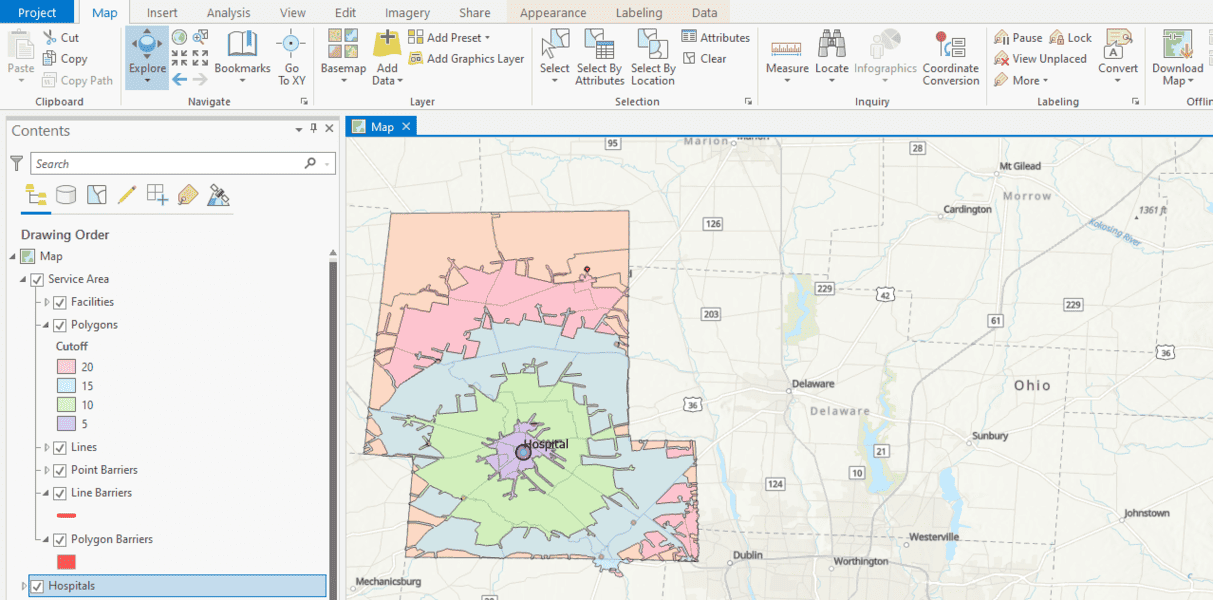
For this GIS tutorial, the service area analyst determines service areas within 5 minutes, 10 minutes, 15 minutes, and 20 minutes from a hospital.
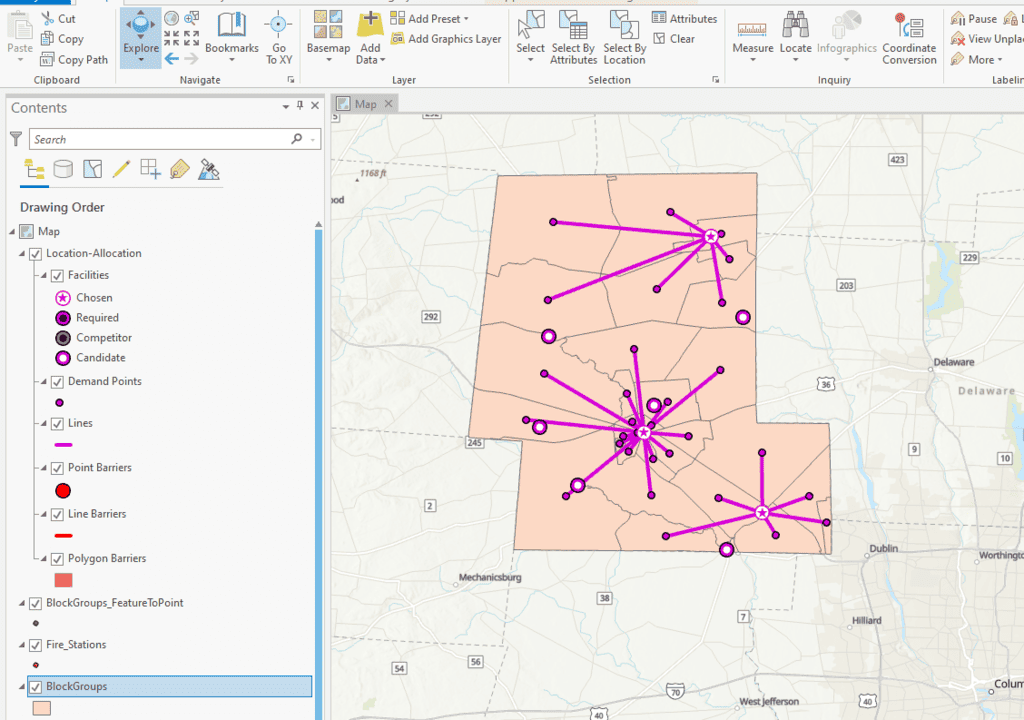
The Location Allocation analyst also determines 3 fire stations from 9 fire stations that provide the best response times to neighboring study blocks.

Hospital and fire GIS data
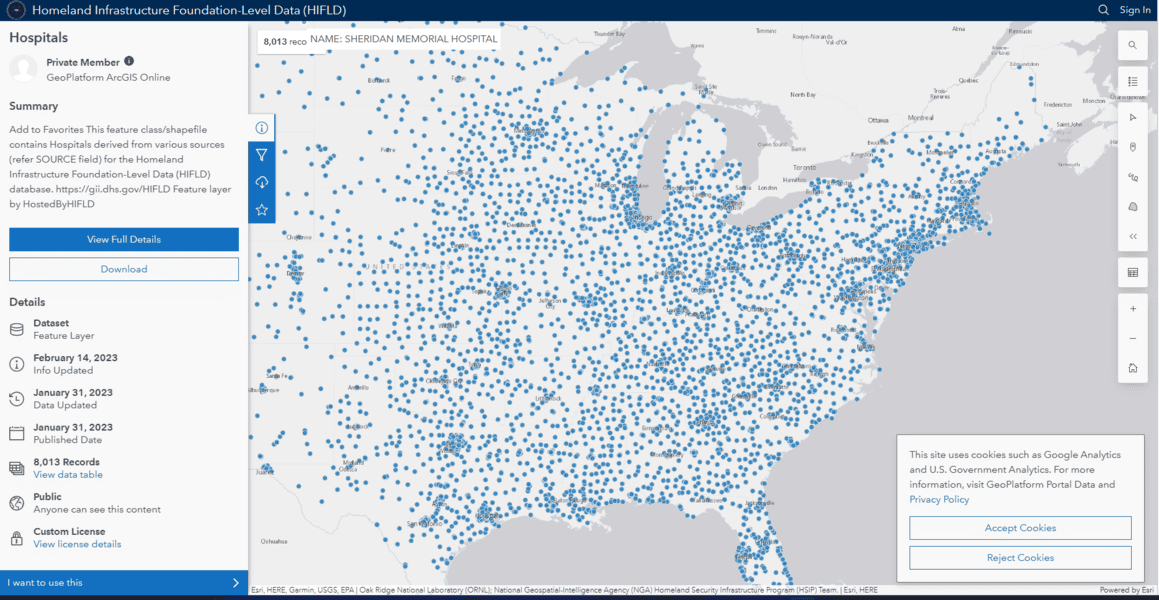
The hospital and fire station data can be accessed from the Homeland Infrastructure Foundation Level Data (HIFLD)’s website. Retrieve the hospital data for your desired area of interest in the United States via the Homeland Infrastructure Foundation-Level Data (HIFLD) web map application for hospitals.
To access the fire station data for your desired area of interest in the United States, use the the Homeland Infrastructure Foundation-Level Data (HIFLD) web map application for fire stations.
For this tutorial, data are in shapefile format.

Adding hospital and fire data to ArcGIS Pro
To import the fire and hospital data into ArcGIS Pro:
- Open and create a new project in ArcGIS Pro.
- From the Map tab, select the “Add Data” icon.
- Navigate to the location of the fire and hospital data.
- Select all the data to be imported and click OK.
Performing service area analysis in ArcGIS Pro
A service area in ArcGIS is a region that encompasses all accessible streets (or, more broadly, network locations) within a given distance or travel time from a facility. “Accessibility” is determined based on the travel settings (mode, direction, restrictions, etc.) defined for the analysis.
For this tutorial, we are going to perform a network analysis in ArcGIS Pro to determine the service area of hospitals in our geographic area of interest:
- Highlight the “hospital layer” by clicking on it.
- From the Analysis tab, click network analysis.
- Select “Service Area” from the drop-down menu that appears (figure 3)

- A service area multilayer is generated on the Contents panel. From the service area tab, select “import facilities.” (figure 4)

- Set input locations to hospital data.
- Be sure to check the “Snap to Network” box.
- Click Apply and OK.
- From the Service Area tab, set direction to “Away from facilities.”
- Set “Cut off” to 5, 10, 15, 20. This denotes that a time window of 5, 10, 15, and 20 minutes will be considered and categorized during the analysis.
- Open “travel settings” from the Service Area tab (figure 5)

- Set travel type to “driving.”
- Set “Impedance” to minutes.
- Set “distance cost” to length_miles.
- Click OK.
- Select Run from the Service Area tab to run the model.
Note that the service area analysis can also be performed using a single travel time cut off.
For this tutorial, the Service Area analysis was performed by using an area of interest (polygon – figure 6). Analysis can also be performed by using roads (vector lines).

Performing location allocation analysis in ArcGIS Pro
Next we are going to determine the three best fire stations that can provide (or allocate) the best service to the local population in our study area.
To perform network analysis (Location allocation) in ArcGIS Pro:

- Highlight the “Fire stations layer” by clicking on it.
- From the Analysis tab, click network analysis.
- Select “Location Allocation” from the drop-down menu that appears.
- Location Allocation multilayer is generated on the Contents panel. From the Location Allocation tab (figure 7), select “import facilities.”
- Set input locations to fire stations data (figure 8).
- Click Apply and OK.

The task involves reducing the number of available fire stations (nine 9) to the best three (3) which can provide emergency services to the blocks around within the shortest time and distance. There is the need to convert desired area of interest (polygon) into point features for easy processing.
To convert the study area (polygon) to point features in ArcGIS Pro:

- Type and search “Feature to points” from the search bar of the geoprocessing toolbox (figure 9).
- Set “input features” to polygon layer.
- Set “Output feature class” to desired output name and location.
- Click Run.
Ensure that population field is attached to the demand point feature to denote the number of people who will be receiving the fire emergency services for different portions of the study area.
The demand points can be set to the output point features of the study area:
- Select “import demand points” from the Location Allocation tab.
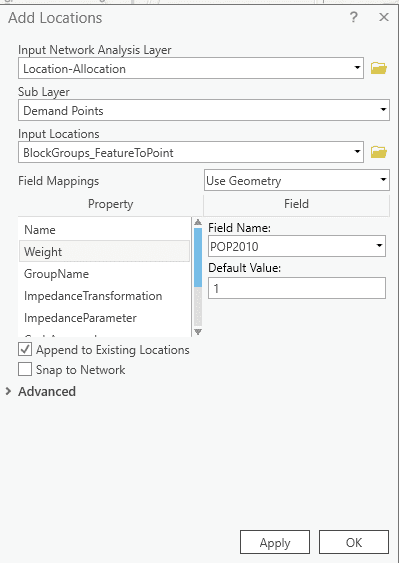
- Set “input locations” to output point features data (figure 10).
- From the property drop-menu, select weight.
- Ensure to set weight to the “Population field.”
- Click Apply and OK.

- Open “travel settings” from the Location Allocation tab.
- Set travel type to “driving.”
- Set “Impedance” to minutes.
- Set “distance cost” to length_miles.
- Click OK as shown in figure 6.
- From the Location Allocation tab, set direction to “away from facilities.”
- Since we are reducing the number of fire stations from 9 to the best 3, we will select 3 for the facilities bar as shown in figure 7.

- Set the Location allocation type to “minimize weighted impedance (P-median).”
- Click Run from the Location Allocation tab.
The resulting analysis shows the best fire station locations for servicing the local population.

