
Jeff Oppong

Collecting GIS Data in the Field Using QGIS and QField
This QGIS tutorial takes you through the steps to synchronize a map project with QField in order to collect GIS data using a mobile device.

Change Detection Using Kernel Density Analysis in ArcGIS Pro
This GIS tutorial provides step-by-step instructions for how to use two point datasets to detect changes in ArcGIS Pro using kernel density.

Georeferencing Scanned Maps in QGIS Using Graticules
This GIS tutorial teaches you how to assign geographic coordinates to a scanned map in QGIS using a process known as georeferencing.

Using interpolation to create a surface layer with contours in QGIS
This GIS tutorial shows you how to find elevation data points and create a surface layer and contours using QGIS.
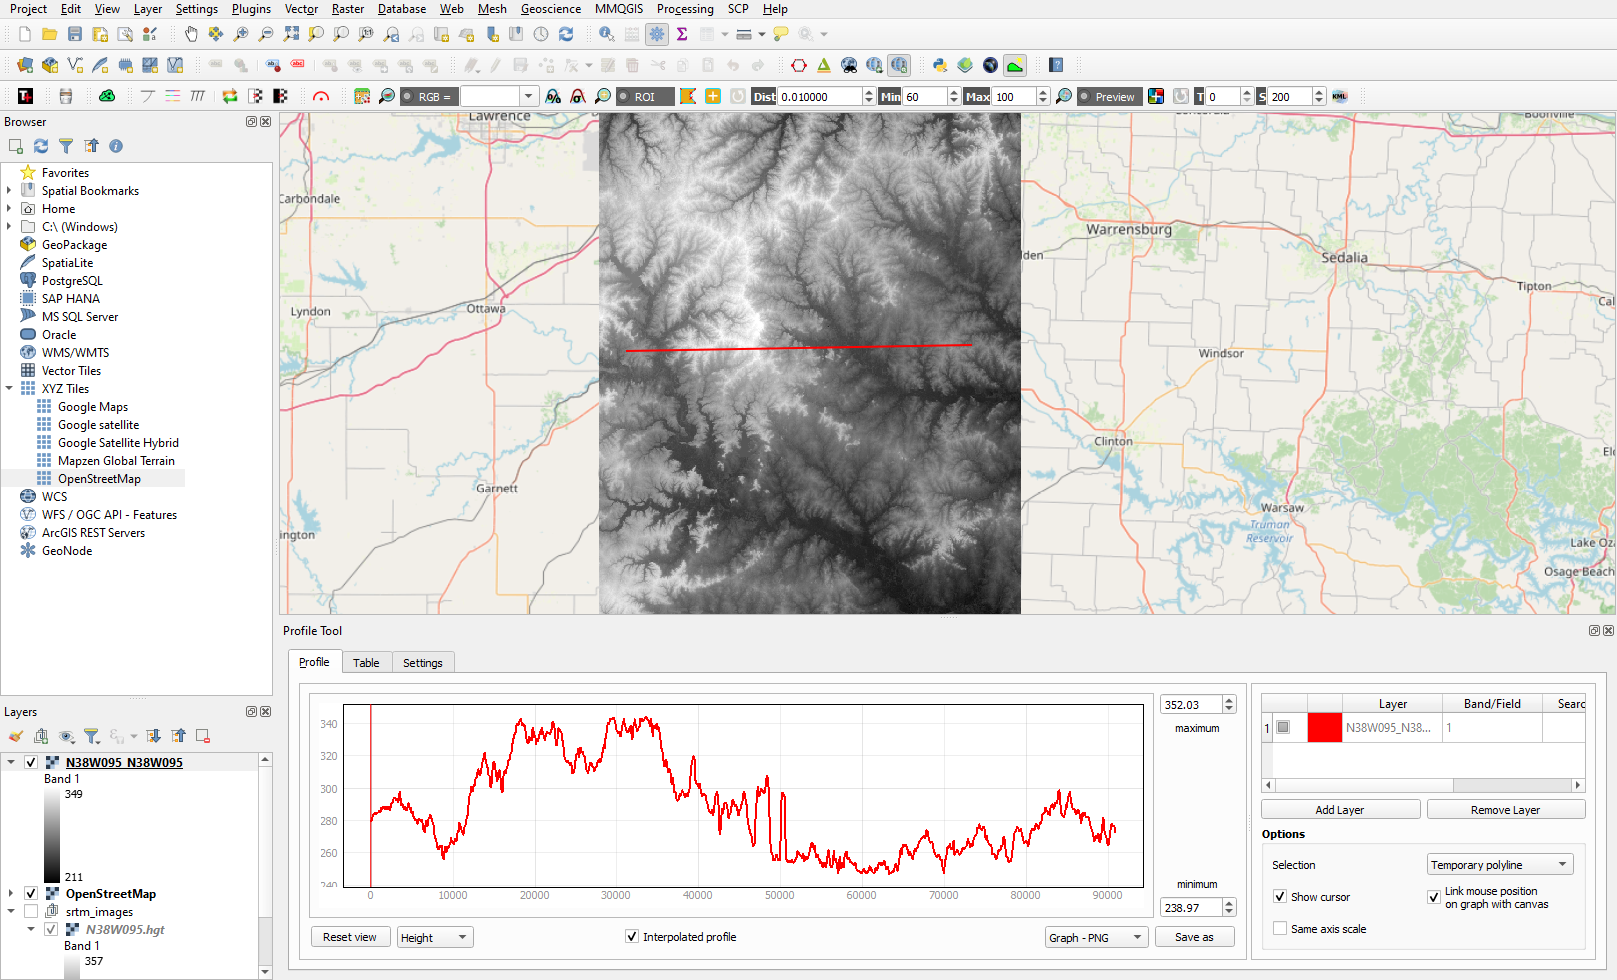
Creating Elevation Cross-Section Profiles with QGIS
Learn to create elevation cross-sections in QGIS with the Profile Tool plugin and SRTM elevation data.

How to Create Isochrone Maps in QGIS
Learn how to create isochrone maps in QGIS to visualize travel times, find the fastest and shortest routes, and analyze accessibility.

Getting Started with the ArcGIS Business Analyst Web App
This GIS tutorial provides a brief introduction to using the ArcGIS Business Analyst Web App.
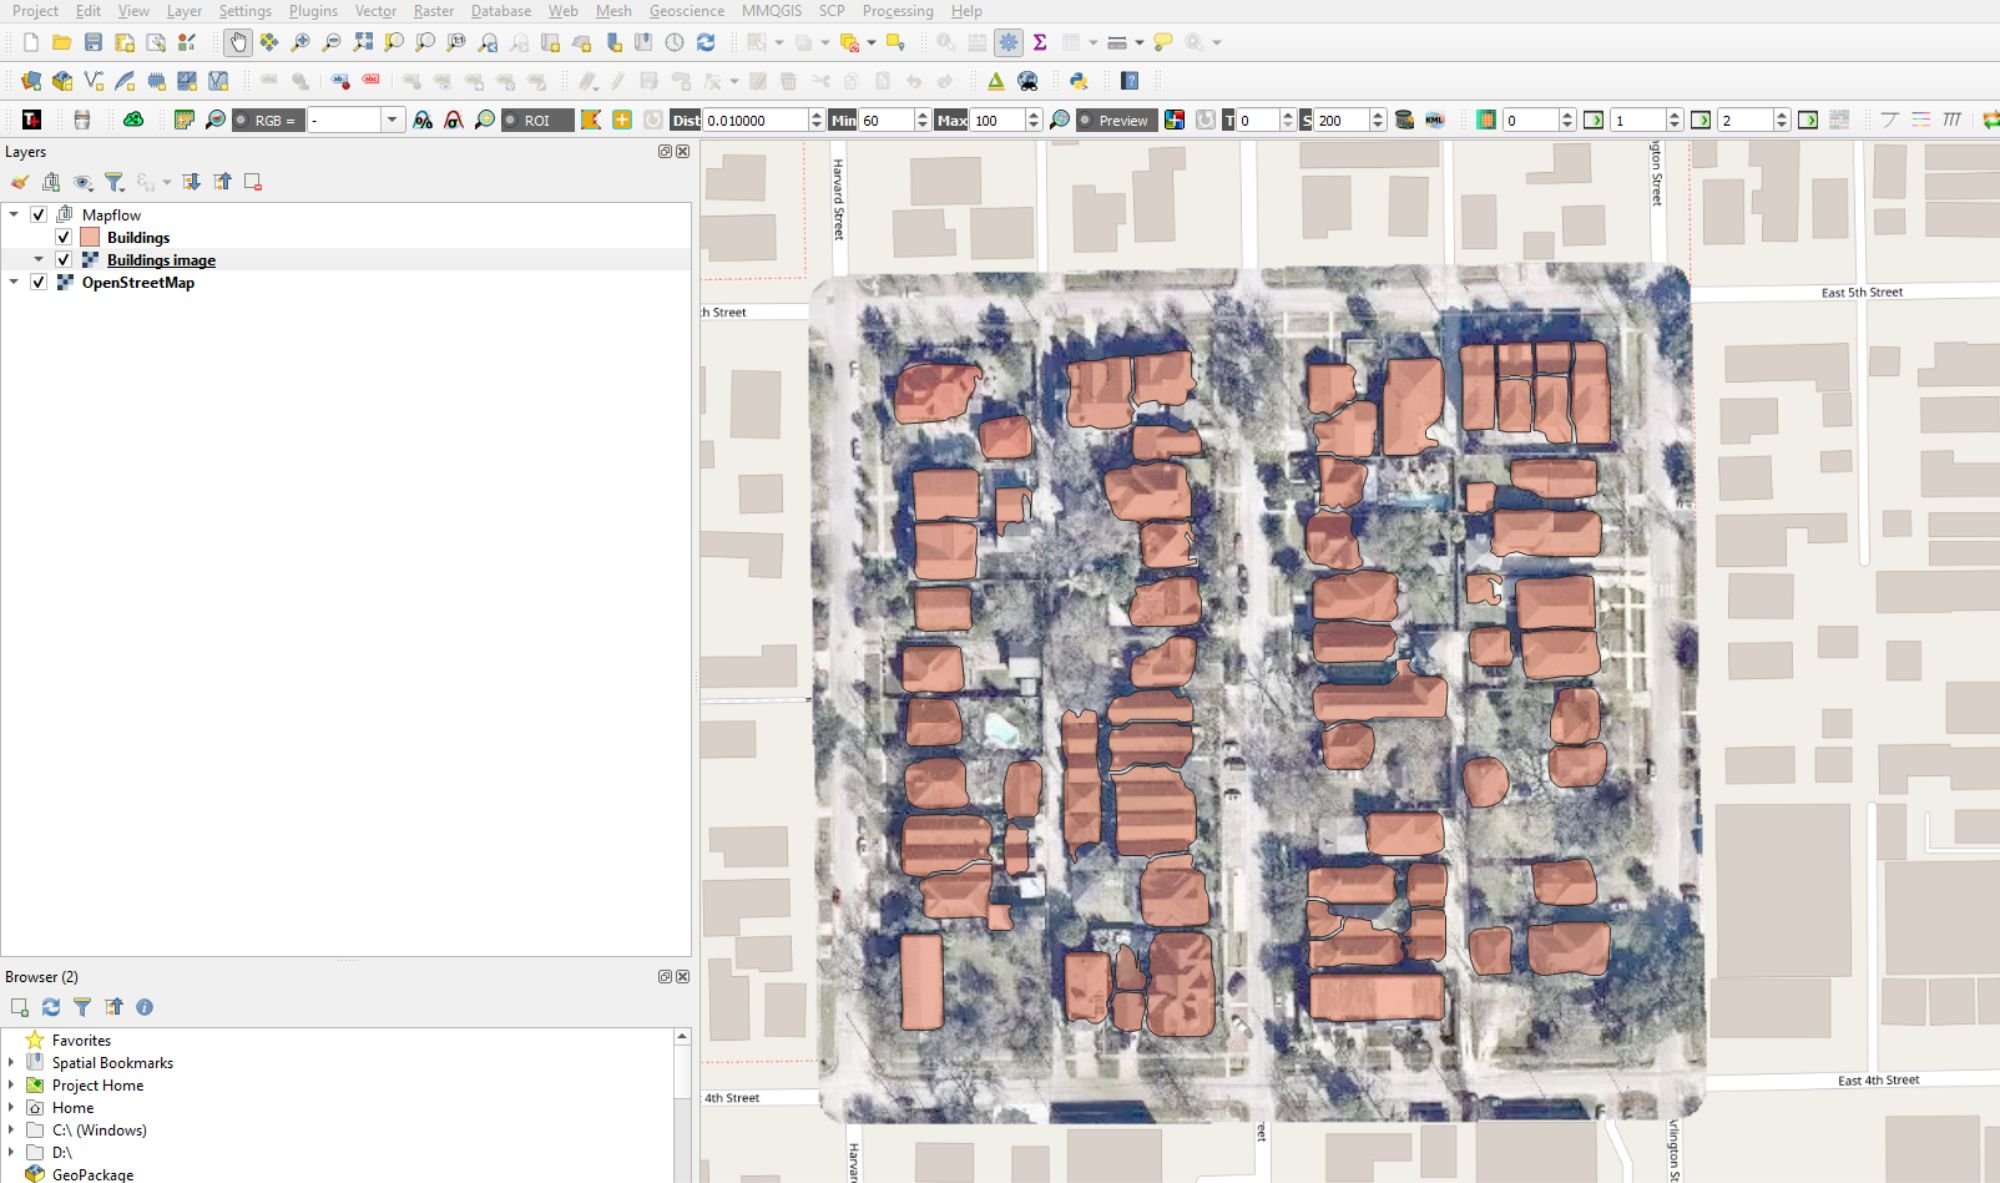
Automatic Digitizing of Imagery Using QGIS
This QGIS tutorial takes you step-by-step through the process of automatically digitizing building footprints using the Mapflow plugin and OpenStreetMap aerials.
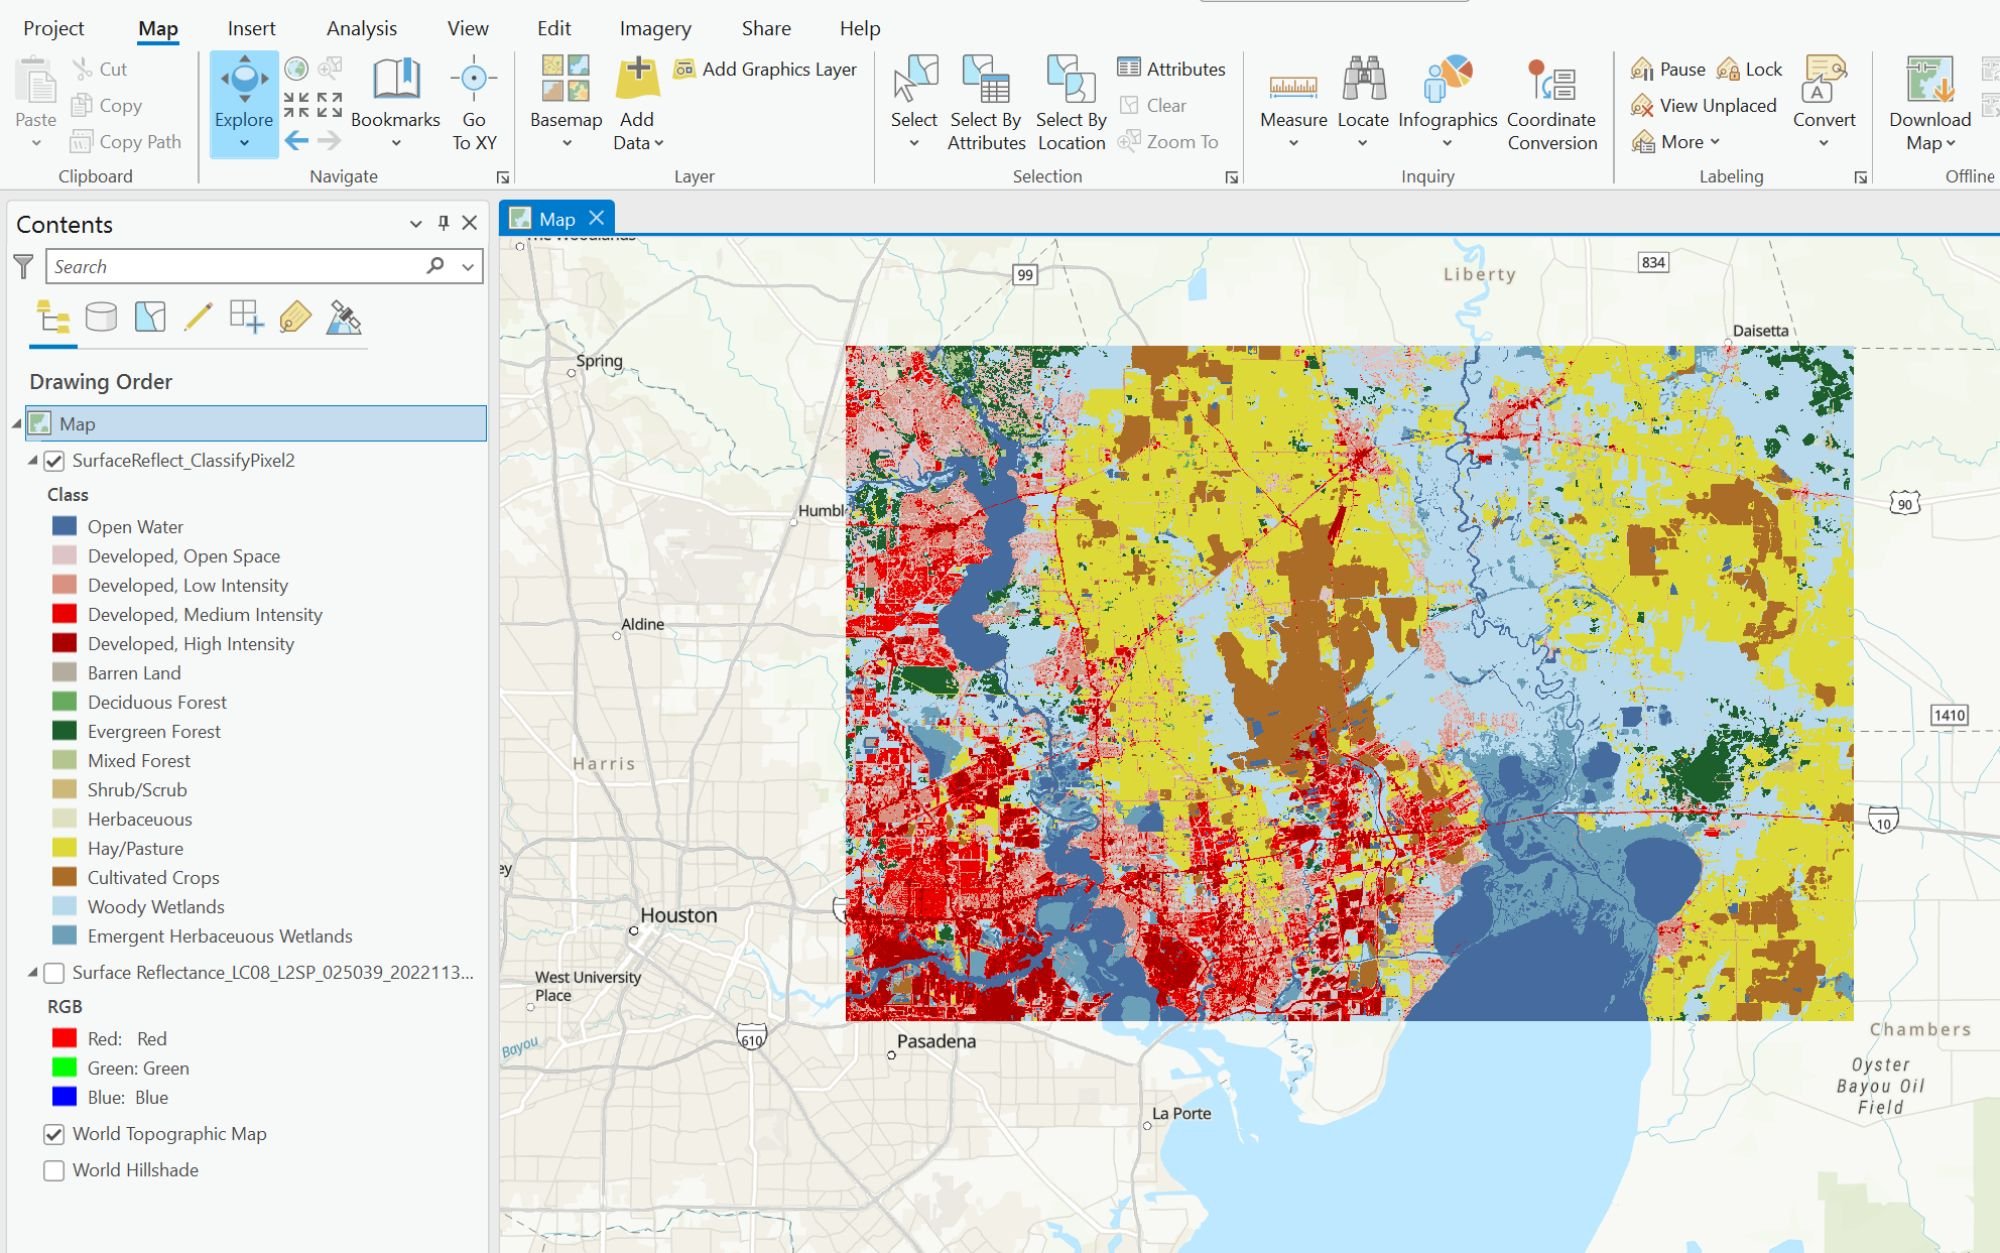
Using Deep Learning to Map Land Cover in ArcGIS Pro
This GIS tutorial provides step-by-step instructions on how to use deep learning models and Landsat 8 satellite imagery in ArcGIS to classify land cover.
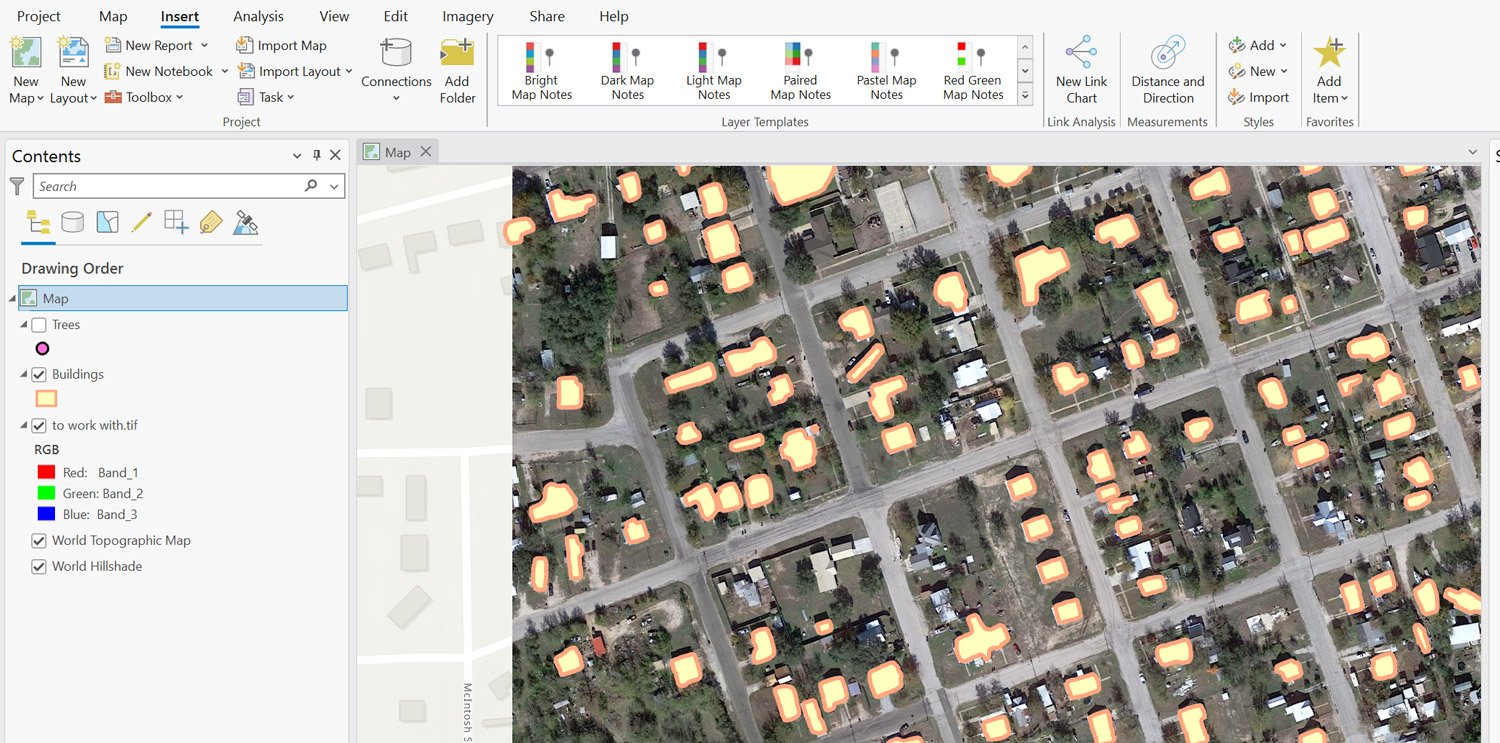
Extracting Building Footprints and Trees from Imagery Using ArcGIS Pro
This tutorial teaches you how to extract trees and building footprints from satellite imagery using ArcGIS Pro.

Mapping Earthquakes with ArcGIS Pro
This step-by-step tutorial shows you how to use USGS data and ArcGIS Pro to map earthquakes and geological faults.

Create a Bathymetric Map Using ArcGIS Pro
This step-by-step GIS tutorial shows you how to create a bathymetry map using ocean data from GEBCO.

Mapping Buildings in 2.5D Using ArcGIS Pro
Learn how to find and use building footprint data from OpenStreetMap to create a 2.5D map in ArcGIS Pro.
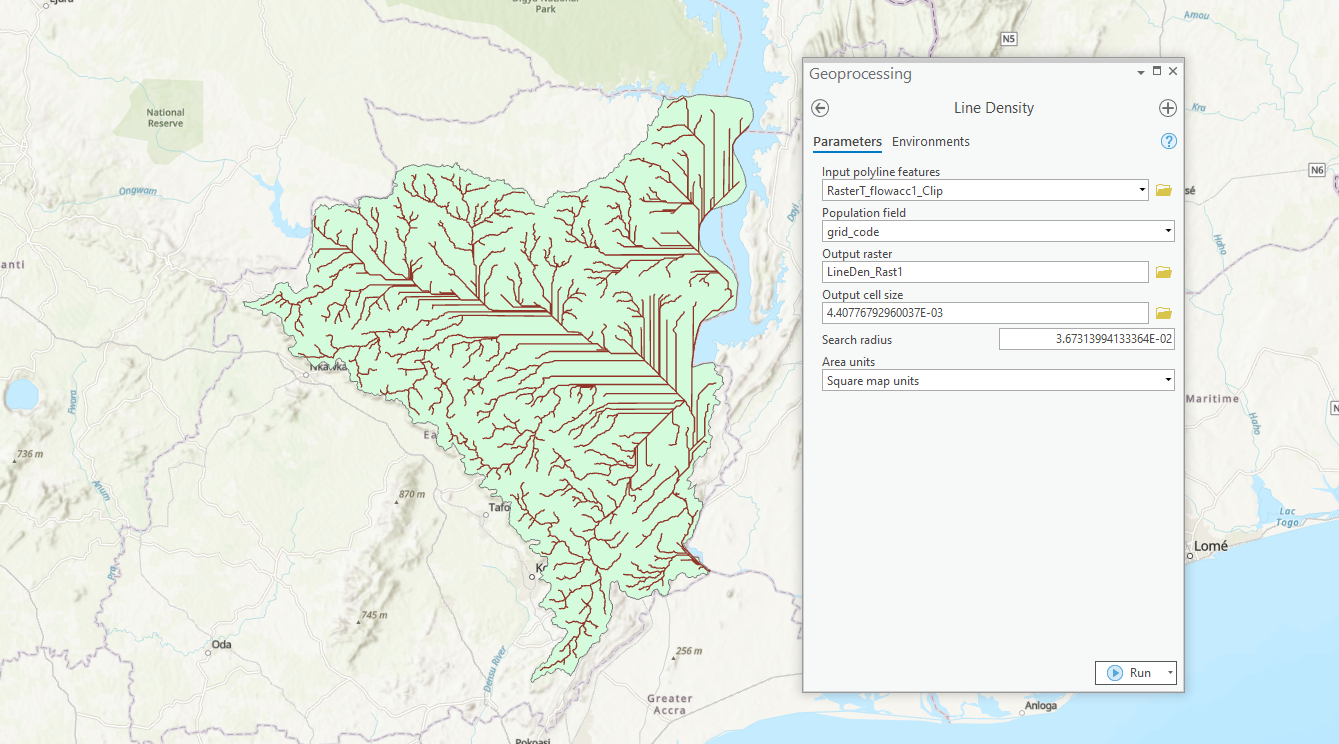
How to Map Watersheds Using ArcGIS Pro: A Step-by-Step Guide
This tutorial shows you how to use ArcGIS Pro to delineate watersheds and drainage paths from elevation data.

Overview of Elevation Data
This article reviews some of terminology and types of elevation based datasets available to GIS.

How to Use the Suitability Modeler in ArcGIS Pro
Learn how to use the suitability modeler in ArcGIS Pro to map out suitable areas given a set of criteria.
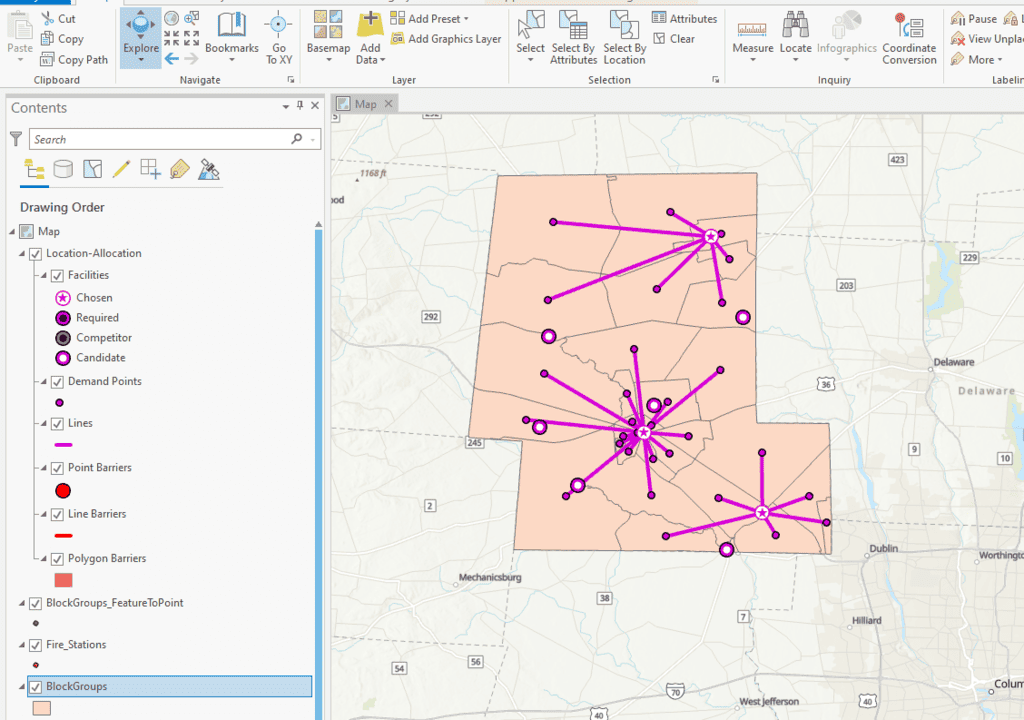
How to Perform Location Allocation Analysis in ArcGIS Pro
This ArcGIS Pro tutorial uses hospital and fire station GIS data to analyze services areas and location allocation.
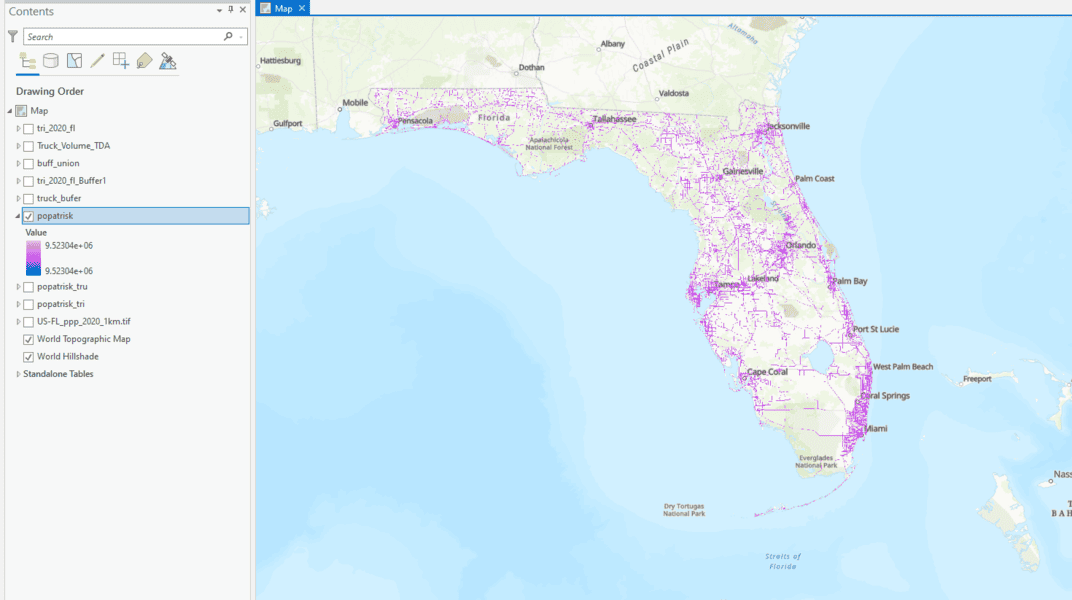
How to Use ArcGIS Pro to Determine the Population Impacted by Air Pollution
Learn to estimate air pollution's impact on people with geospatial methods using ArcGIS Pro and data from Toxic Release Inventory, Worldpop, and ArcGIS Hub.

How to Create an Air Pollution Map Using ArcGIS Pro
This GIS tutorial outlines how to use ArcGIS Pro to map air pollution using data from the United States Environmental Protection Agency.
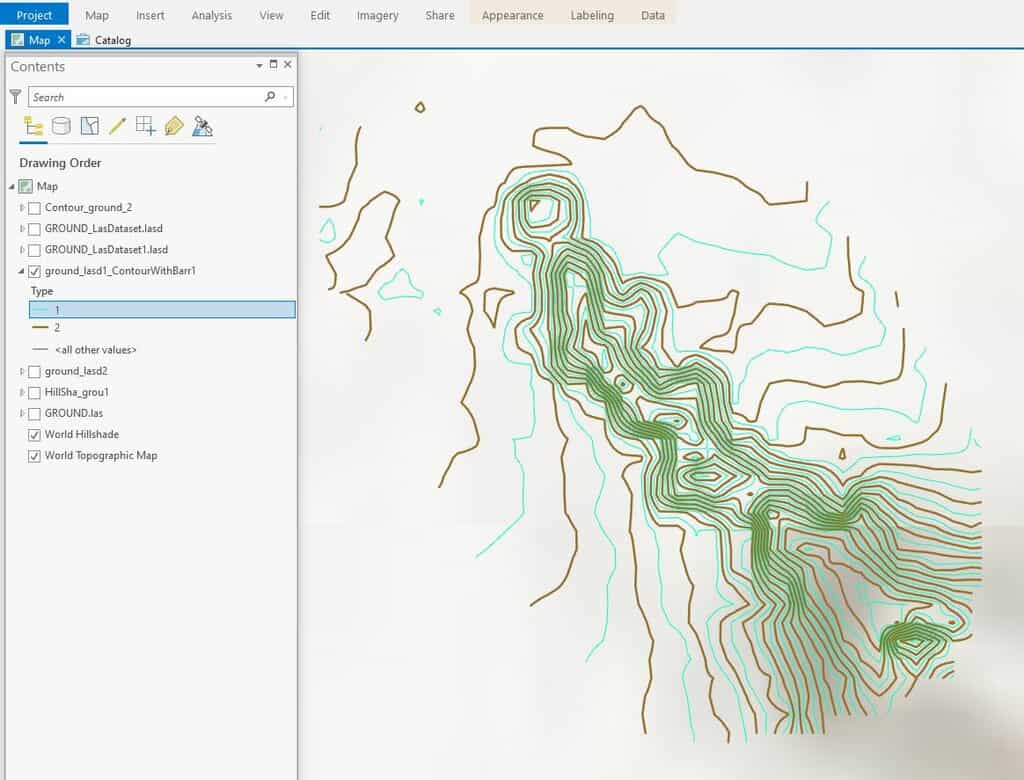
How To Create Contours in ArcGIS Pro from LIDAR Data
This ArcGIS Pro tutorial shows how to add LIDAR data from the National Map to ArcGIS Pro and create topography contours.
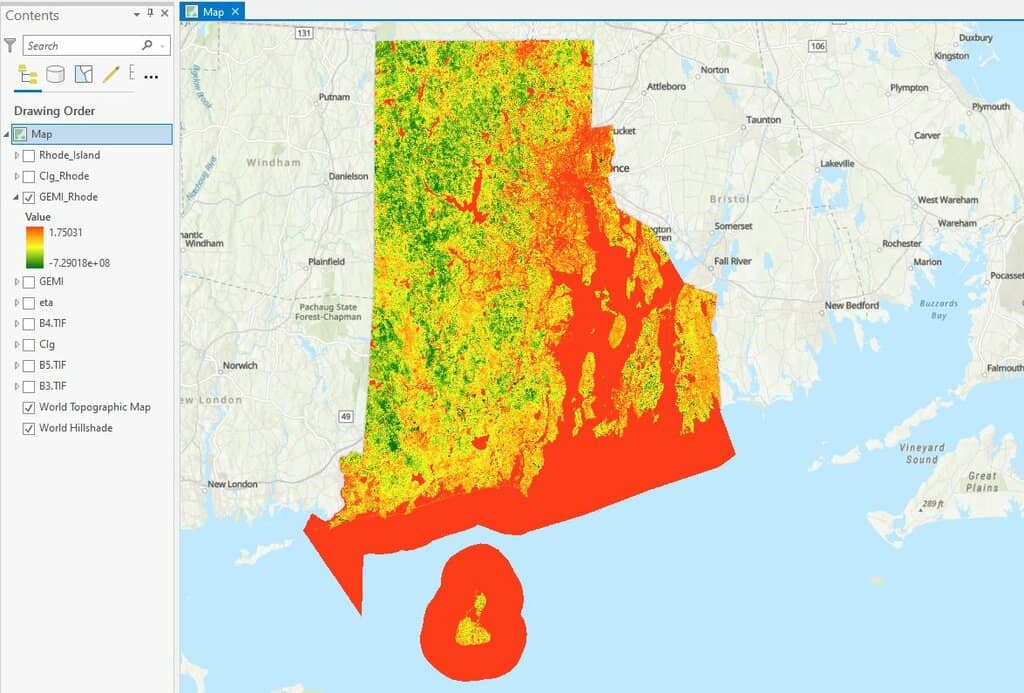
How to use ArcGIS Pro and Landsat 8 Imagery to Calculate Chlorophyll Index and Global Environmental Monitoring Index
Learn to create a chlorophyll index using Landsat 8 imagery in ArcGIS Pro with this step-by-step GIS tutorial.

How to Use ArcGIS Pro for Supervised Classification
This ArcGIS Pro tutorial provides a step-by-step guide for performing supervised classification on Landsat 8 imagery using remote sensing and GIS techniques.

How to Use ArcGIS Pro to Estimate Soil Erosion from a Catchment Basin
This lesson shows how to use spatial data science and remote sensing techniques in ArcGIS Pro to predict soil erosion in a catchment area using the Universal Soil Loss Equation (USLE).

How to Use ArcGIS Pro for Fire Risk Mapping
Tutorial showing how to map fire risk for a region with slope, elevation, aspect, and land use data in ArcGIS Pro.
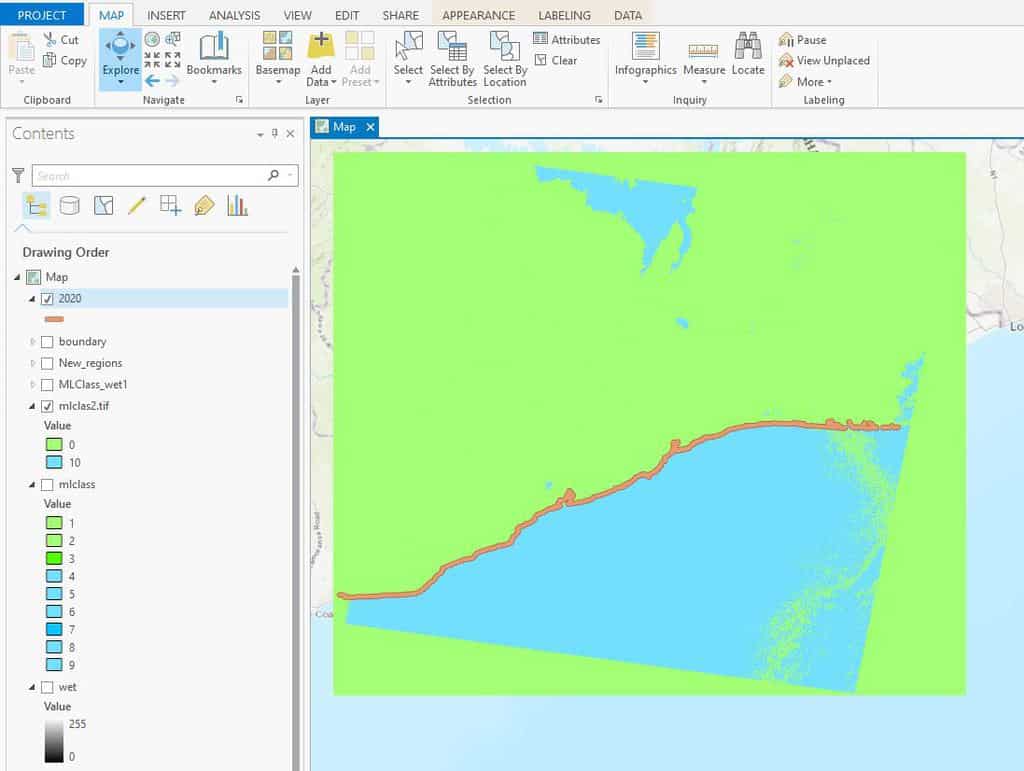
How to Use ArcGIS Pro for Automatic Shoreline Delineation from Landsat Imagery
Learn how to extract shorelines in ArcGIS Pro using the Tasseled Cap and NDVI indices with the Landsat toolkit for automatic shoreline delineation.

How to Use ArcGIS Pro to Map Flood Susceptibility
This tutorial makes use of spatial data science and remote sensing techniques to assess the susceptibility of floods using ArcGIS Pro.