The advent of GIS tools and technologies has helped immensely in identifying, quantifying, and solving problems. GIS also provides a proactive way of rendering solutions by researching possible situations and implementing preventive schemes.
Over the years, GIS has improved the quality of lives of individuals through areas like telecom and network services, accident/incident analysis, urban planning, transportation planning, environmental impact assessment, flood damage estimation, natural resources management, environmental health, and safety, vegetation monitoring, among many others.
Using ArcGIS Pro as a Tool to Develop Vegetation Indexes
ArcGIS Pro is a valuable tool in the geospatial field today. It enables the creation, editing, management, and storage of geo-data and attribute information across various application areas.
Additionally, ArcGIS Pro has supported the implementation of numerous schemes by providing scientific empirical evidence, bridging the gaps between scientific research and the professional industry. It has contributed to solving problems in social, physical, environmental, economic, and socio-economic contexts.
Vegetation Index Concepts in Geospatial
Considering the immense benefits of vegetation in recent times, there is a need to combine a definite scientific approach with geospatial tools to determine the state and spatial extents of vegetation cover. This prior knowledge will help inform proactive strategies for land use and ecosystem management. A relevant tool to pioneer in determining the eco-balance of the biosphere through vegetation monitoring of plants is satellite imagery.
Although many vegetation index concepts have evolved rigorously considering the role of green infrastructure in improving and sustaining the current demands of the global economy, correction of atmospheric effects is a considerable challenge.
Among the several vegetation indexes, the Chlorophyll Index (CI) and Global Environmental Monitoring Index (GEMI) have evolved. The difference between the Chlorophyll Index and GEMI is that GEMI considers atmospheric effects during the use of vegetation index procedures whereas CI does not.
GIS Tutorial to Determine Chlorophyll Index (CI) and the Global Environmental Monitoring Index (GEMI)
As a result, this tutorial establishes a base for the improvement and sustenance of green vegetation in the global ecosystem by making use of Remote Sensing and geospatial techniques (ArcGIS Pro) to outline steps to follow to determine the Chlorophyll Index (CI) and the Global Environmental Monitoring Index (GEMI) of Landsat 8 imagery in an area of interest.
Figure 1 below shows a summary of the geospatial methodology employed during the process.

Calculation of Chlorophyll Index
To calculate the chlorophyll Index from Landsat 8 imagery in ArcGIS Pro, the following steps should be taken:
- Open ArcGIS Pro and create a new project. Select blank project from the interface that appears. Select and set output location and name for the new project. Click Ok.
The chlorophyll content in leaves is determined using the ratio of reflectivity in the Near Infrared (Band 5) and Green bands (Band 3). Landsat 8 imagery can be accessed from the USGS Earth Explorer’s website after a free sign up process.
- After, import band 3 and band 5, by selecting the “Add Data” icon on the “Map” tab from the Menu bar.
- Navigate to the location of the bands 3 and 5 and click “Open.”
- Type and search “Raster Calculator” from the search bar of the geo processing toolbox.
Chlorophyll Index is determined by the formula;
CI = ((NIR / Green)-1), where NIR represents pixel values of band 5 and Green represents pixel values of band 3 (Gitelson et al., 1996).
- Type the formula as shown in figure 3 below into the calculator search box.
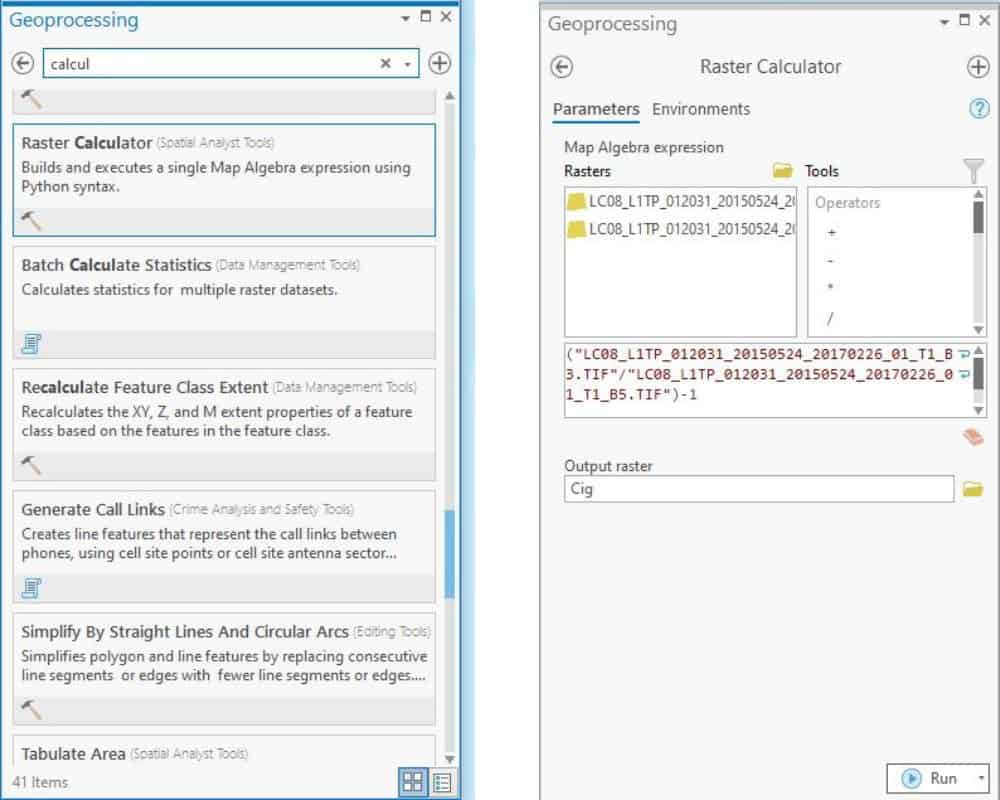
- Click Run.
Calculation of Global Environmental Monitoring Index (GEMI)
For the calculation of GEMI, bands 4 (Red) and 5 (NIR) are used. The difference between GEMI and NDVI is that GEMI is able to withstand atmospheric effects.
The formula for GEMI is given as:
GEMI = Eta*(1-0.25*Eta) – ((Red-0.125)/(1-Red)) for Landsat 8 (Pinty & Verstraete, 1992),
Where Eta = (2*(NIR^2-Red^2) +1.5*NIR+0.5*Red)/(NIR+Red+0.5)
NIR = pixel values from the Near Infrared band (Band 5)
Red = pixel values from the Red band (Band 4)
- To start with, import band 4 onto the map canvas using the “Add data” tool.
- Type and search raster calculator from the search bar of the geoprocessing toolbox.
- From the calculator bar, input the formula as shown in figure 4 below to compute for “Eta.”
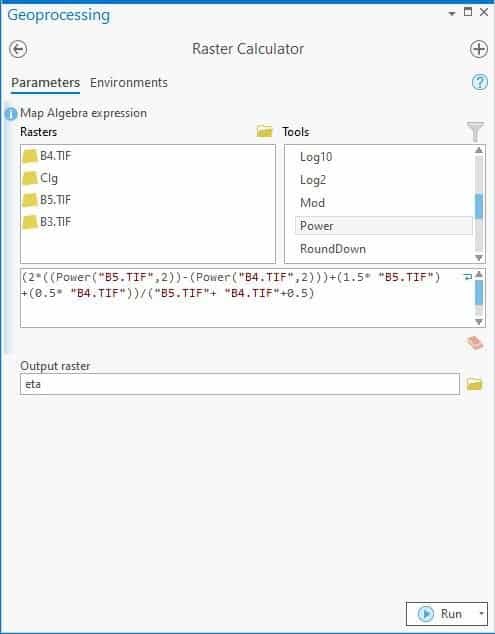
- Click Run.
To calculate GEMI from “Eta”:
- Type and search raster calculator from the search bar of the geoprocessing toolbox.
- From the calculator bar, input the formula as shown in figure 5 below to compute for GEMI.
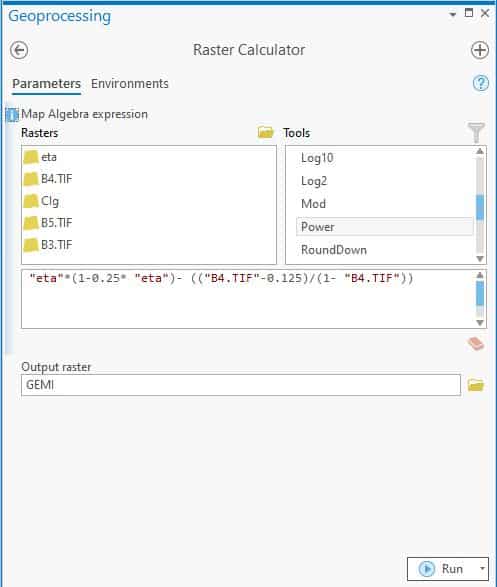
- Click Run.
Clipping to Area of Interest
To consider streamlining the Landsat 8 imagery to a specific area of interest, the following steps are helpful:
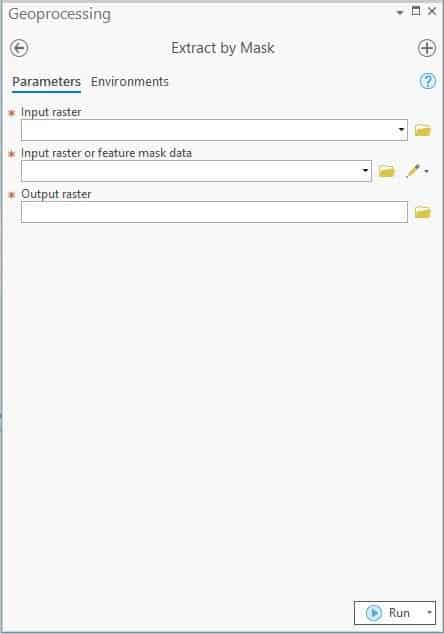
- Type and search extract by mask in the search box of the geoprocessing toolbox.
- From the “extract by mask” panel, set “input raster” to be results of CI.
- Set “feature mask data” to desired boundary extent.
- Set “output raster” to desired location and name of output file.
- Click Run.
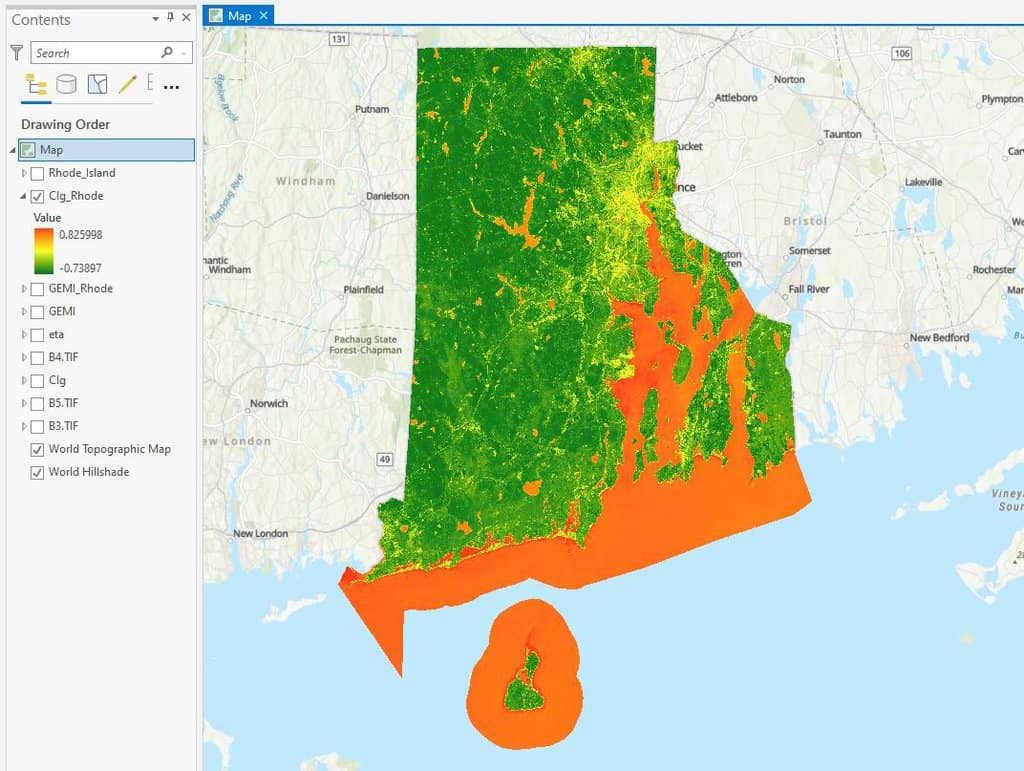
Project Map Showing the Estimation of Chlorophyll Index of Rhode Island in the United States.
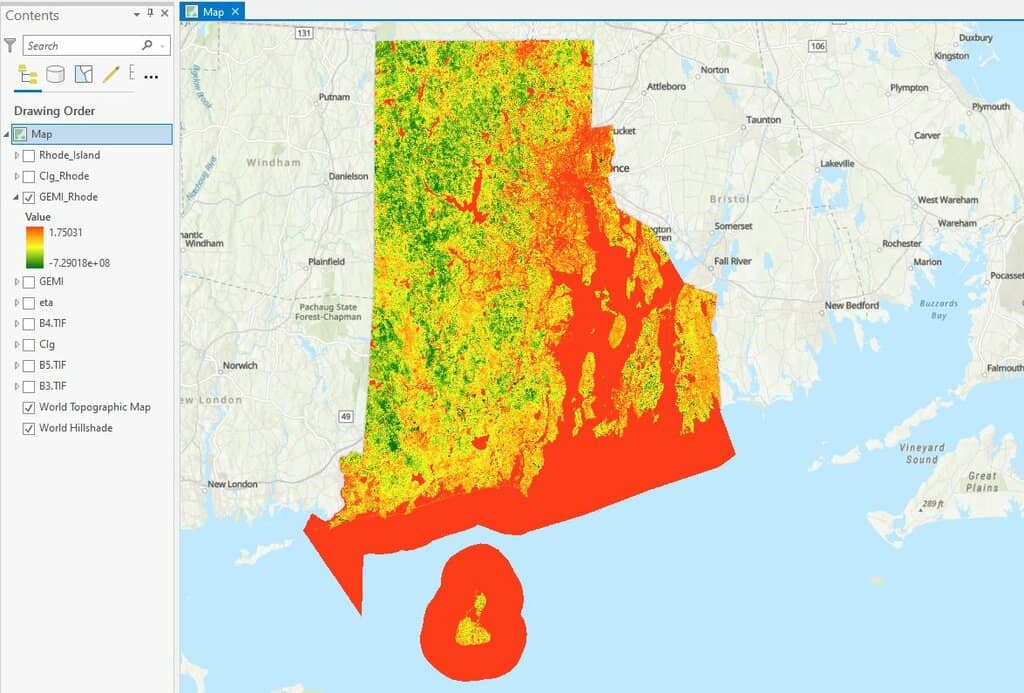
Project Map Showing the Global Environmental Monitoring Index of Rhode Island in the United States.
References
Gitelson, A. A., Kaufman, Y. J., & Merzlyak, M. N. (1996). Use of a green channel in remote sensing of global vegetation from EOS-MODIS. Remote Sensing of Environment, 58(3), 289–298. https://doi.org/https://doi.org/10.1016/S0034-4257(96)00072-7
Pinty, B., & Verstraete, M. (1992). GEMI: A non-linear index to monitor global vegetation from satellites. Vegetatio, 101, 15–20. https://doi.org/10.1007/BF00031911
