Shoreline defines where the land and sea meets at a particular location.
Environmentalists, Coastal Engineers, Aqua-resource personnel make use of shorelines daily to understand how several factors affect the drive of the land-sea boundary. That said, the copious economic transactions surrounding the coasts also necessitate the need to delineate shorelines to serve as empirical evidence for effective futuristic urban and coastal planning procedures.
Shoreline delineation also defines a basis upon which the movement of shorelines can be understudied spatiotemporally. Over the years, manual and automatic shoreline extraction techniques have been adopted and improvised.
Using Tasseled Cap and Normalized Difference Vegetation Index (NDVI) to Map Shorelines
This tutorial contributes to several shoreline extraction techniques using the Tasseled Cap and Normalized Difference Vegetation Index (NDVI) approach in ArcGIS Pro to delineate shoreline automatically using the Landsat toolbox.
One advantage of this technique is land and sea around the coastal zone become distinct and easily identifiable, which helps in the delineation process.
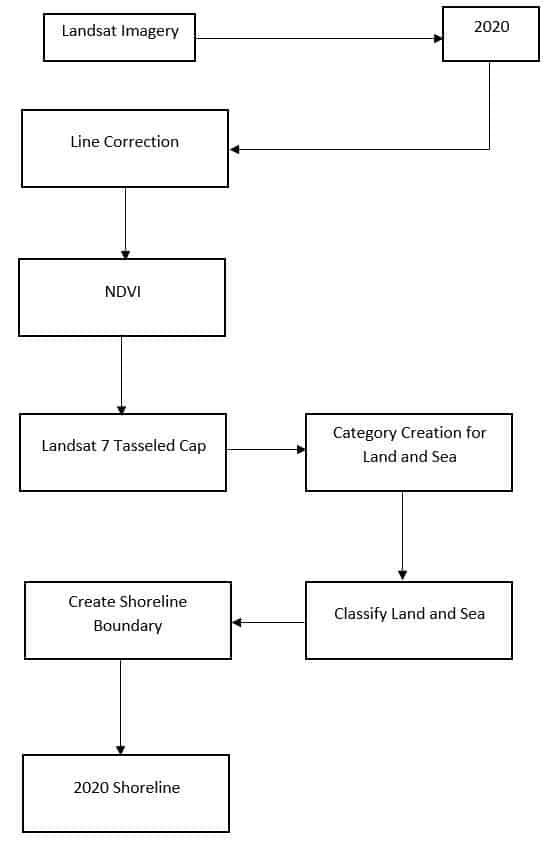
The geoprocessing tools considered during the process are Landsat 7 Tasseled Cap, NDVI, Category Creation for Land and Sea, Classify Land and Sea, and Create Shoreline Boundary.
Figure 1 shows a summary of the geospatial methodological tools utilized in the tutorial.
Preprocessing of Landsat 7 Imagery and Calculation of NDVI
Firstly, Landsat 7 imagery for a desired area of interest is downloaded from the USGS Earth Explorer’s website (EarthExplorer (usgs.gov)). For a step-by-step guidance on how to download Landsat 7 imagery, use the attached video link (How to download Landsat 7 image – YouTube).
To preprocess the Landsat 7 imagery, the following steps are followed;
- Launch ArcGIS Pro, and create a new project from the “project” tab by selecting “blank.” From the insert tab on the menu bar, click on “New Map” to select a new base map.

The Landsat toolbox is used to correct scanline errors and for further automatic shoreline extraction procedures.
The Landsat toolbox can be accessed using this link (https://drive.google.com/file/d/1FKc-G1vMVtWXi66hh15VKoj-zk3UPWgX/view).
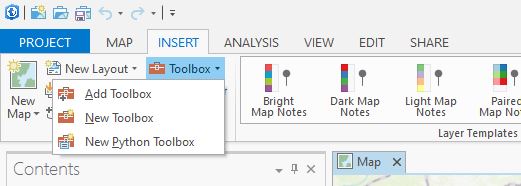
Import the Landsat toolbox onto the map canvas by:
- From the insert tab, click “Add toolbox.” Navigate to the location of the downloaded Landsat toolbox.
- Click “Open.”
Import the bands of the Landsat 7 imagery by:
- Select “Add Data” from the Map tab.
- Navigate to the location of the bands of the downloaded Landsat 7 imagery. Select all the bands 1, 2, 3, 4, 5, and 7.
- Click “Open.”
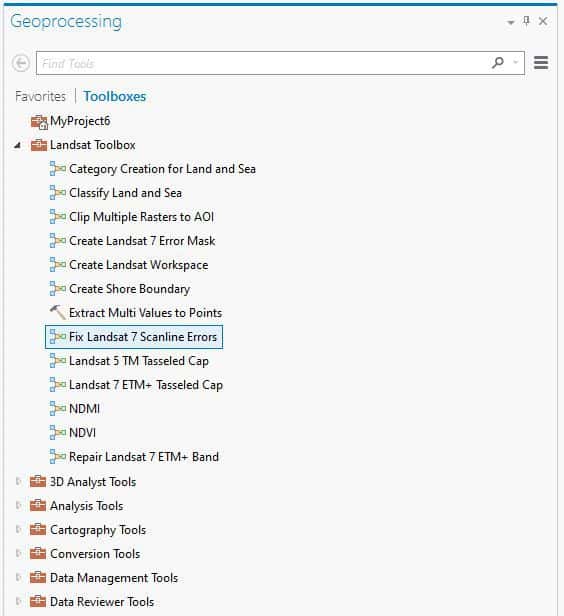
- From the list of toolboxes in the geoprocessing toolbox, select the “Landsat Toolbox.”
- Select “Fix Landsat 7 Scanline Errors” from the drop-down menu.
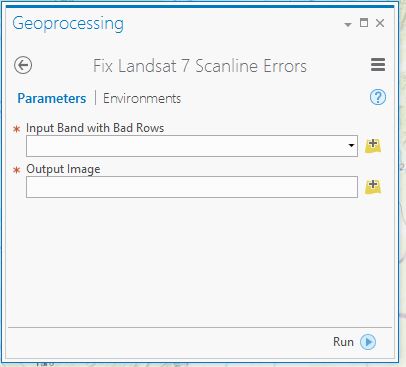
- Set “Input Band with Bad Rows” to Band 1.
- Set “Output Image” to the desired output name and location, and click “Run.”
Repeat the steps outlined above to correct scanline errors for the rest of bands 2, 3, 4, 5, and 7.
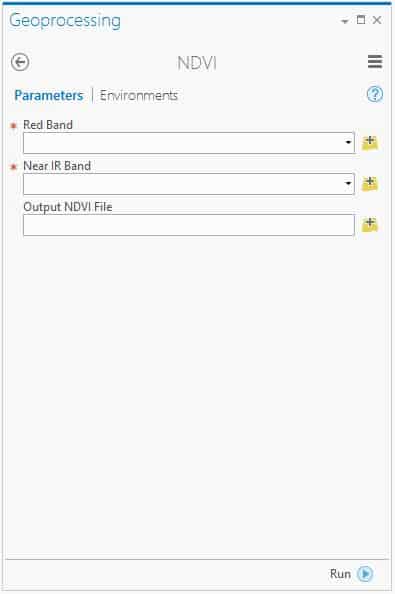
To calculate and estimate NDVI, the raster calculator or Landsat toolbox can be used. For this tutorial, the Landsat toolbox is used following the steps:

- Select “NDVI” from the drop-down menu of the Landsat toolbox.
- Set “Red band” to band 3 and “Near IR band” to band 4.
- Set “Output NDVI file” to the desired output name and location.
- Click “Run.”
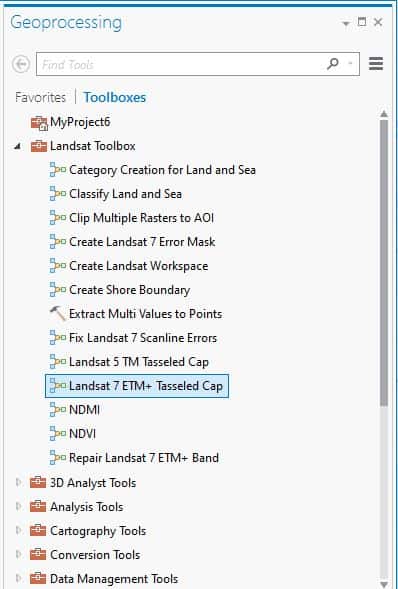
“Landsat 7 Tasseled Cap” and “Category Creation for Land and Sea” in ArcGIS Pro
The Landsat 7 Tasseled Cap analysis makes room for a conversion of orthogonal transformation of the original data into a new dimensional space.
For this tutorial, the new dimensional space consists of the brightness, greenness, and wetness index.
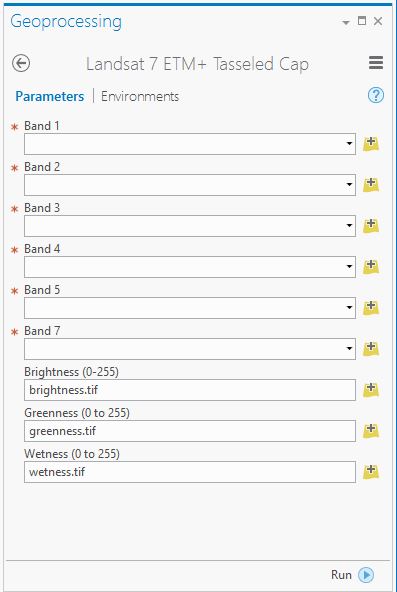
The following steps are adhered to, during the conversion process in ArcGIS Pro:
- Click “Landsat 7 ETM+ Tasseled Cap” from the drop-down menu of the Landsat Toolbox.
- Set Bands 1, 2, 3, 4, 5, and 7 to their corrected respective bands.
- Set “Brightness,” “Greenness,” and “Wetness” to the desired output name and location.
- Click “Run.”
To create a category for land and sea in the Landsat imagery, follow the outlined steps below:
- Click “Category Creation for Land and Sea” from the drop-down menu of the Landsat Toolbox.
- Set “Input Raster Bands” to the results of “Brightness,” “Wetness,” “NDVI,” and “Greenness.”
- Set “IsoClus_auto.GSG,” and “Dendrog_auto.TXT” to save an output report with a desired name and to a preferred location.
- Set “Classified raster 10 classes” to a desired location and with a preferred name.
- Click “Run.”

“Classify Land and Sea” and “Create Shoreline Boundary” in ArcGIS Pro
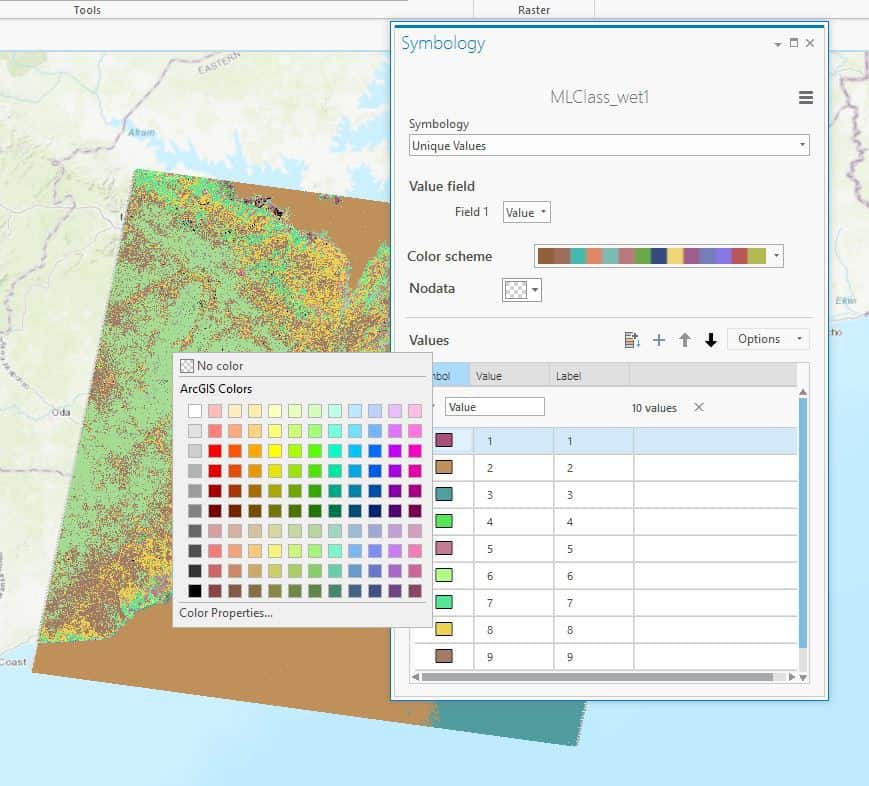
The result obtained for “Category Creation for Land and Sea” requires classification into Land and Sea by color using the ArcGIS Pro basemap as a reference.
For classification of the several colors into two distinct colors representing land and sea:
- Right-click on the result layer for “Category Creation for Land and Sea,” and select “Symbology.”
- From the Symbology panel, set all the features on the sea to blue, and set all the features on the land to green.
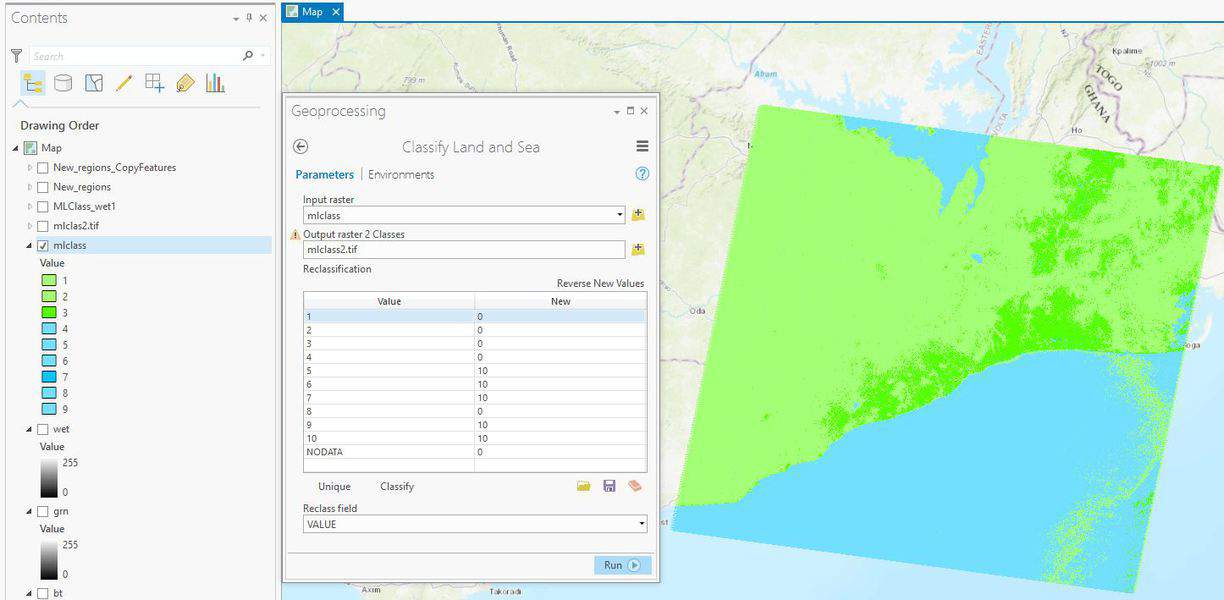
The tool, “Classify Land and Sea” will be used to reclassify the results obtained from the manual classification and colorization performed above into two distinct classes by following the steps outlined:
- Click “Classify Land and Sea” from the drop-down menu of the Landsat toolbox.
- Set “input raster” to results of the manual classification of land and sea.
- Set “Output Raster 2 Classes” to desired output location and name.
- Identify the relationship between the numbers represented by “Value” and “New” on the Classify Land and Sea panel.
- Ensure that “New” is represented by two distinct numbers which represents Land and Sea.
- Click “Run.”
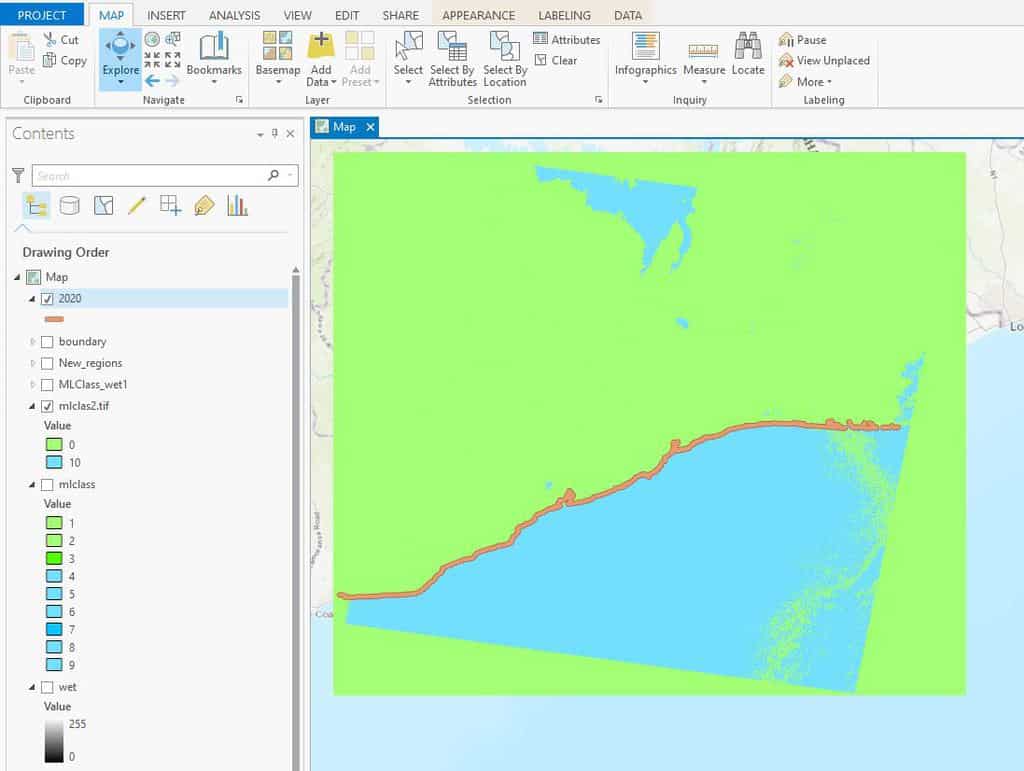
To automatically delineate shoreline from the results of “Classify Land and Sea”:
- Click on “Create Shoreline Boundary” from the drop-down menu of the Landsat toolbox.
- Set “Input raster” to results of “Classify Land and Sea.”
- Set “AOI” to boundary around the shoreline to be extracted.
- Click “Run.”
More ArcGIS Pro Tutorials
- How to Perform a Site Selection Analysis in ArcGIS Pro
- How to Use ArcGIS Pro to Map Flood Susceptibility
- How to Use ArcGIS Pro to Map Urban Heat Islands
- How to Use ArcGIS Pro to Estimate Areas Prone to Malaria
- How to Use ArcGIS Pro to Calculate Land Surface Temperature (LST) from Landsat Imagery
