Land Surface Temperature (LST) is defined by the National Aeronautics and Space Administration (NASA) Earth Observatory as how hot the “surface” of the Earth would feel to the touch in a particular location.
Many areas of research, including global climate change, hydrological and agricultural processes, and urban land use/land cover, increasingly rely on LST. The advent of remote sensing images has eased the calculation of Land Surface Temperature spatiotemporally; through its thermal radiance as LST is a significant factor in controlling environmental, biological, chemical, and socio-economical processes on the earth.
Consequently, this tutorial utilizes spatial data science and remote sensing techniques (ArcGIS Pro) to access the LST in a region. Normalized Difference Vegetation Index (NDVI), Brightness Temperature (BT), and Land Surface Emissivity (LSE) are factors that will be considered in the calculation process as well as making use of Landsat 7 and Landsat 8 thermal bands. (Related: How to Use ArcGIS Pro to Map Urban Heat Islands)
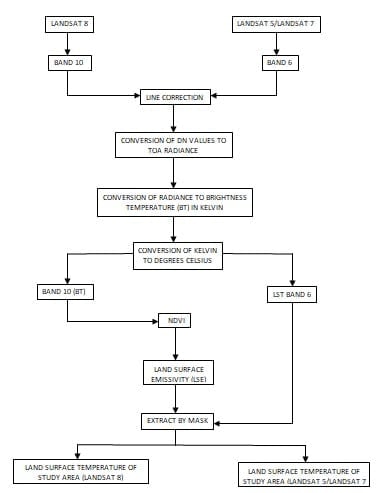
Figure 1 summarizes the procedure that will be adhered to in undertaking this tutorial.
Working with Landsat 5 and Landsat 7 Imagery
Landsat 7/Landsat 5 imagery can be downloaded freely from USGS.com. For this tutorial, Landsat 7 imagery will be used. The same steps will hold for the Landsat 5 imagery. After downloading the imagery, line correction will be performed on the imagery.
The Landsat toolbox can be downloaded from https://drive.google.com/file/d/1FKc-G1vMVtWXi66hh15VKoj-zk3UPWgX/view. After, the toolbox can be imported, and used for scanline correction using the following steps:
- Open and create a new project in ArcGIS Pro.
- Select insert tab from the menu bar. Click the “add toolbox” icon from the Toolbox drop-down menu. Toggle to the location of the Landsat toolbox to select it.

- Type and search “Fix Landsat 7 Scanline Errors.” Set “input Band with Bad Rows” tab to Band 6 of Landsat 7.
- Set the “output image” to the desired output name and location. Results obtained will be Landsat 7 Band 6 imagery free of scanline errors.
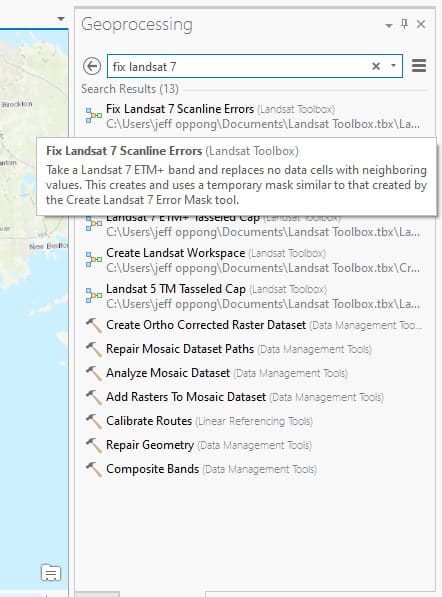
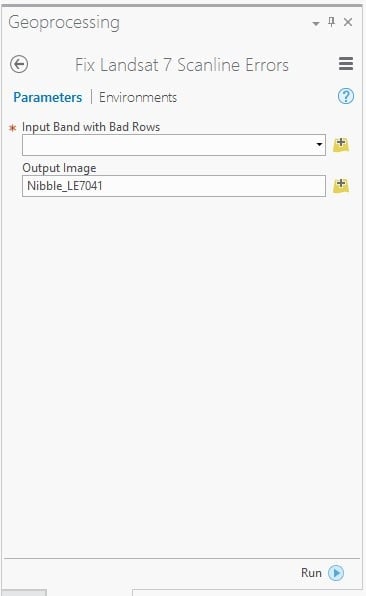
Figure 5 shows the formulas for the calculations undertaken at each stage of the analytical process. Some of the variables as illustrated in figure 4 can only be found in the metadata (MTL) file of the Landsat imagery, which happens to contain all the attribute information of the imagery.

Formulas for Estimated LST from Landsat 5 and Landsat 7

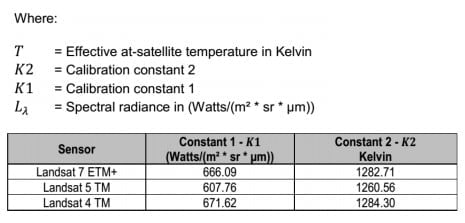

Outlined below are steps to follow in undertaking the formulations in Figure 5 in ArcGIS Pro:
- Type and search for “raster calculator” from the geoprocessing search bar.
- Use the calculation as shown in Figures 5 and 6 to convert Digital Numbers (DN) values to Top of Atmosphere radiance.
- Set output raster to the desired name and location.
- Click, “Run.”
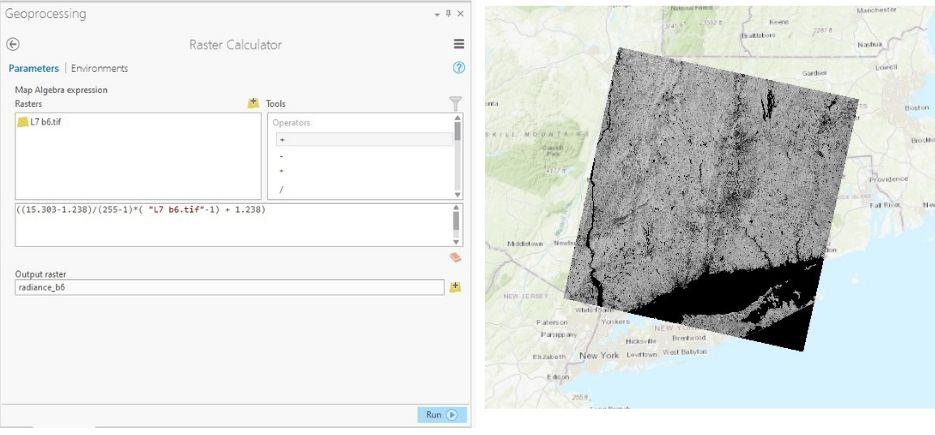
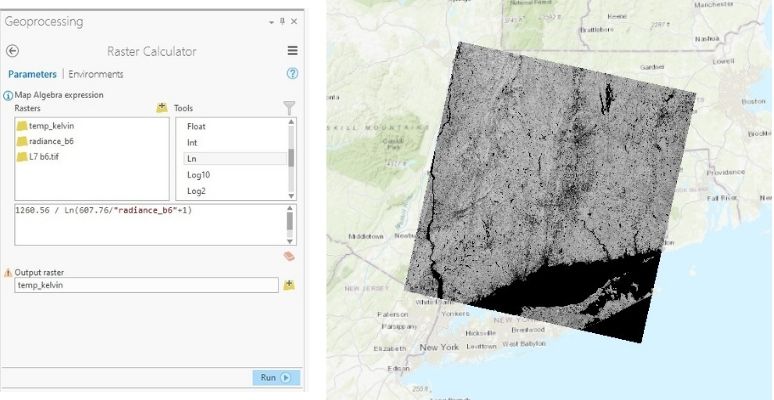
In order to convert Radiance to Brightness Temperature, the following steps should be adhered to;
- Type and search raster calculator from the search bar of the geoprocessing toolbox.
- In the calculation bar of the map algebra (raster calculator), key in the formulas as shown in figures 5 and 7.
- Set “output raster” to the desired name and location.
- Click, “Run.”
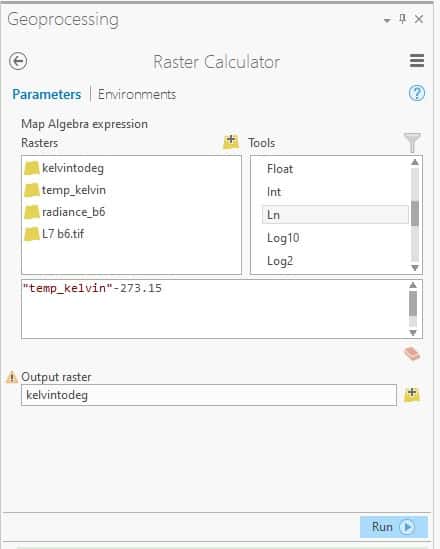
To convert from Kelvin to Degree Celsius, subtract 273.15 from the results of “BT in Kelvin” as follows, and click, “Run.”
Working with Landsat 8 Imagery
After downloading the imagery, line correction should be performed on the band 10 (thermal infrared) of the imagery as illustrated above.
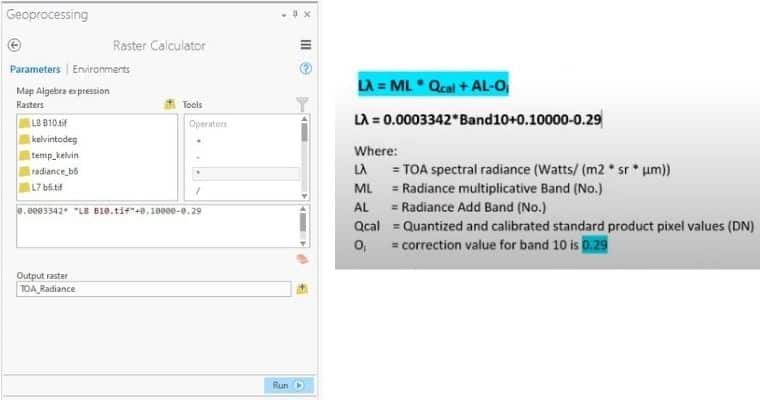
In order to convert the Digital Numbers (DN) to Top of Atmosphere (TOA) radiance, the following steps should be taken;
- In the search bar of the geoprocessing toolbox, type and search, “raster calculator.”
- The following formula (figure 9) should be typed into the calculation bar of the map algebra (raster calculator).
- Set “output raster” to the desired name and location.
- Click “Run.”
In order to convert the thermal band from TOA Radiance to Brightness Temperature (BT), the following steps should be followed;
- In the search bar of the geoprocessing toolbox, type and search “raster calculator.”
- Type the BT formula into the calculation bar of the map algebra (raster calculator).
- Set “output raster” to the desired name and location.
- Click “Run.”
BT=
From the formula in figure 10, “-273.15” is added, to convert the results from Kelvin to Degree Celsius.
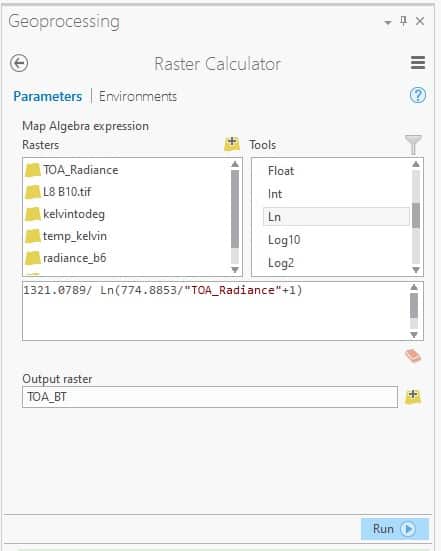
Table 1 also summarizes the inferences that will have to be made on the “MTL” extension file (metadata) in undertaking the calculation process.
| Variable | Description | Value |
| K1 K2 | Thermal constants, Band 10 | 774.8853 1321.0789 |
| Lmax Lmin | Maximum and Minimum values ofRadiance, Band 10 | 22.00180 0.10033 |
| Qcalmax Qcalmin | Maximum and Minimum values ofQuantize Calibration, Band 10 | 65535 1 |
| Oi | Correction value, Band 10 | 0.29 |
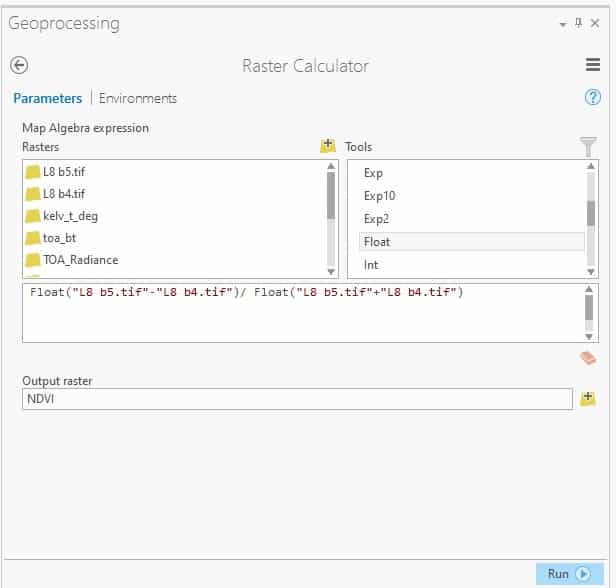
To calculate NDVI,
- Band 4 and Band 5 of Landsat 8 should be imported onto the map canvas by the “Add data” tool after line correction had been performed on them.
- Raster calculator should be typed and searched from the search bar of the geoprocessing window.
- The formula below should be typed into the calculation bar of the raster calculator.
NDVI= (Band 5 – Band 4)/ (Band 5+ Band 4)
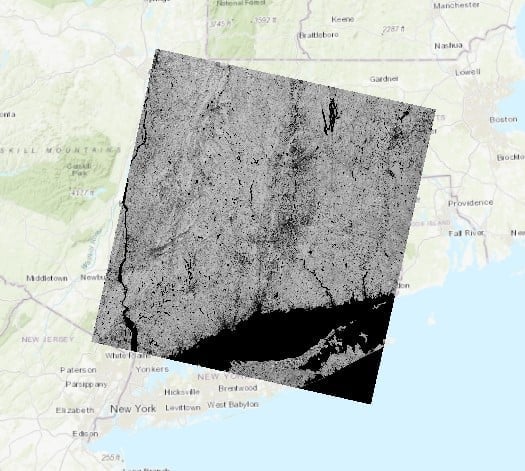
Proportional value vegetation will be calculated from NDVI, using the following formula and steps;
- Launch the raster calculator.
- Input the following formula as shown in figure 9 into the calculation bar.
- Set “output raster” to the desired name and location.
- Click “Run.”

PV=
The following formula should be inputted into the calculation bar of the raster calculator in order to calculate Land Surface Emissivity (LSE). Click, “Run.”
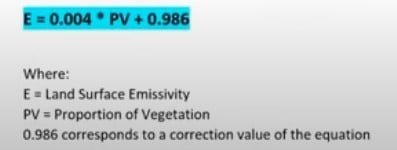
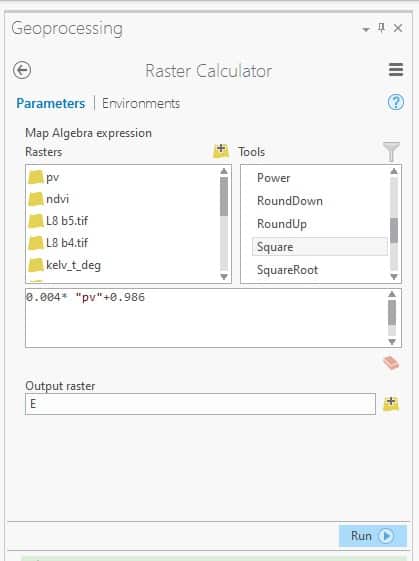
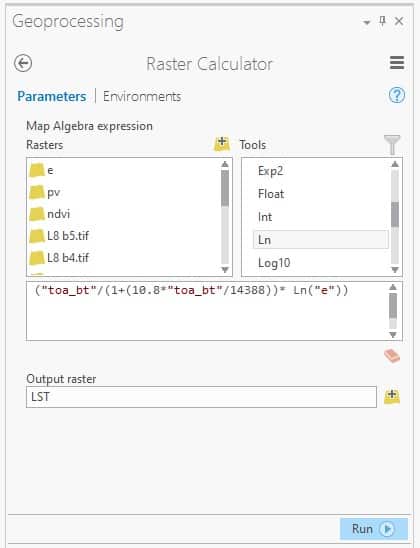
LST can be calculated from LSE, BT and NDVI. The following steps will be adhered to;
- Open raster calculator.
- Set “output raster” to the desired name and location.
- The following formula should be inputted into the calculation bar of the raster calculator window.
- Click “Run.”

Clipping of LST to Study Area
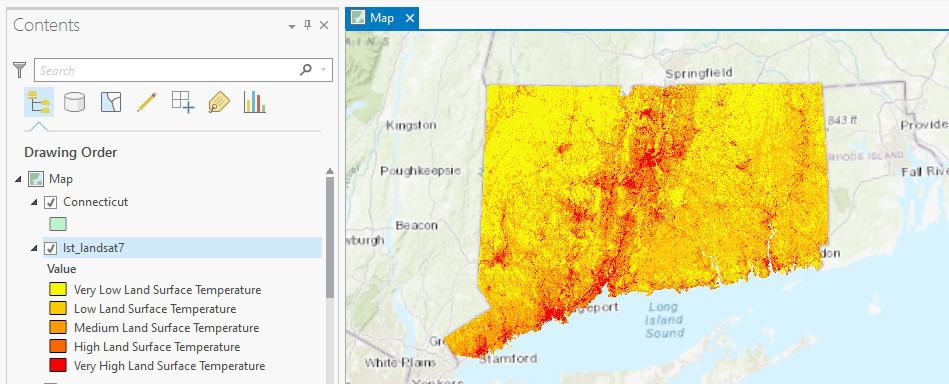
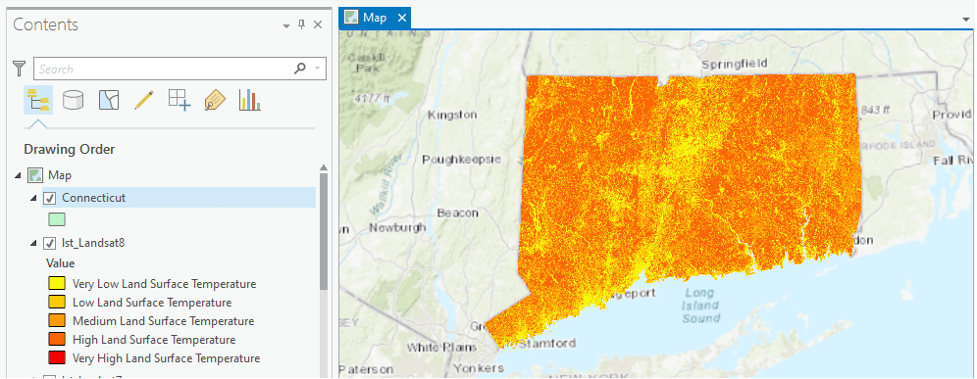
To limit the extent of the Landsat imagery to an area of interest, follow the steps below;
- Type and search “extract by mask” from the search bar of the geoprocessing toolbox.
- Set “input raster” as LST Landsat 7.
- Set “output raster” as the desired name and location.
- Click “Run.”
- Repeat steps for LST Landsat 8.
Further Resources
For more information on LST inverse with the radiative transfer equation procedure see: Yu, X., Guo, X., & Wu, Z. (2014). Land surface temperature retrieval from Landsat 8 TIRS—Comparison between radiative transfer equation-based method, split window algorithm and single channel method. Remote sensing, 6(10), 9829-9852. https://doi.org/10.3390/rs6109829
More ArcGIS Pro Tutorials
- How to Use ArcGIS Pro to Map Urban Heat Islands
- How to Use ArcGIS Pro to Assess Landslide Susceptibility
- How to Use ArcGIS Pro to Estimate Areas Prone to Malaria
