
remote sensing

Choosing the Right Satellite Bands for Remote Sensing
Learn how different satellite sensors respond to Earth's features and which spectral bands are best for remote sensing.

Mapping Building Heat Using Remote Sensing
Startup Satellite Vu launched the first of a satellite constellation to measure building heat signatures in high resolution.

GIS and Map Contests
Current map and GIS related competitions listed in order of the competition deadline.

Mapping Tornado Tracks with Satellite Data
Researchers used satellite imagery and remote sensing to map tornado tracks.

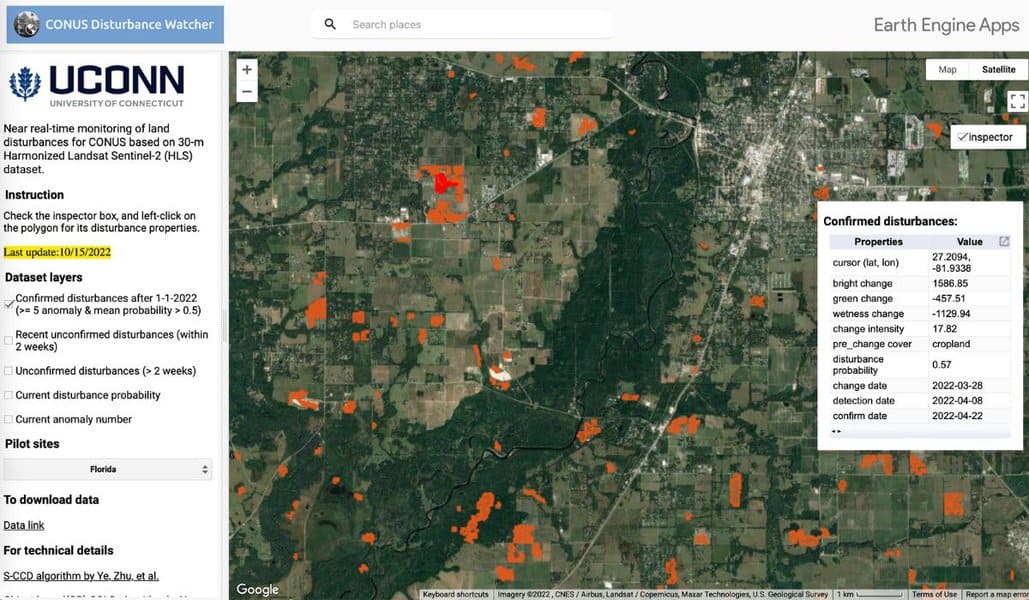
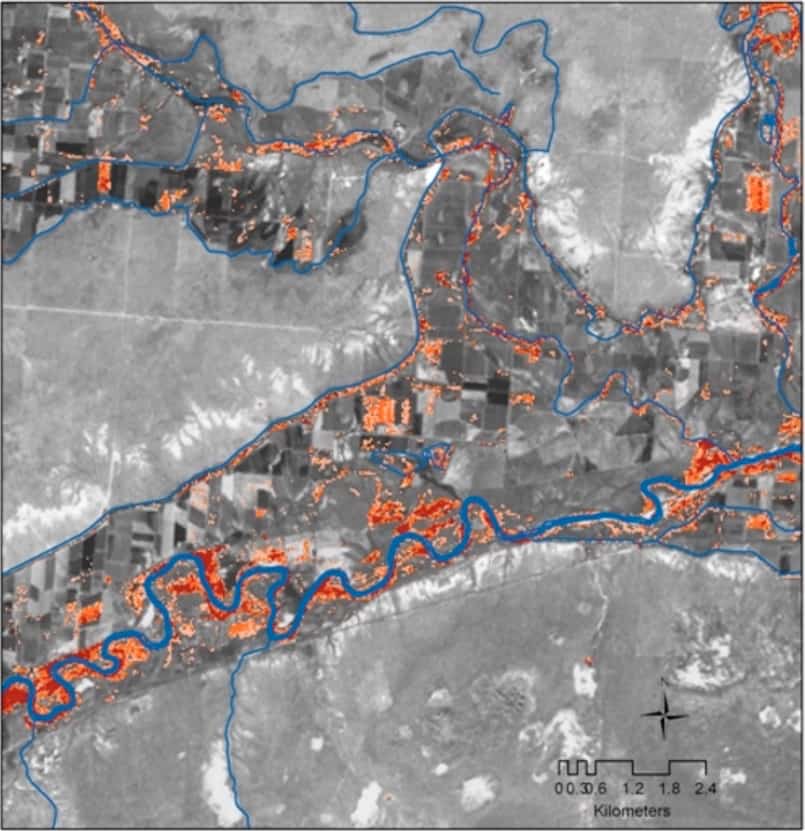
Mapping Long-term Land Use Change with Remote Sensing Data
Discover how remote sensing technology is used to map land use changes, providing valuable insights into environmental impacts and aiding conservation efforts.
Using Geospatial Technologies to Map Hurricane Response
Using satellite data and artificial intelligence, researchers have developed a way to rapidly map hurricane destruction.

Advancements in Mapping Jellyfish: Integrating Remote Sensing and Geospatial Technologies
Mapping swarms of jellyfish has significantly improved due to a combination of remote sensing data, UAV and satellite data, and algorithms that estimate jellyfish migration based on current data.
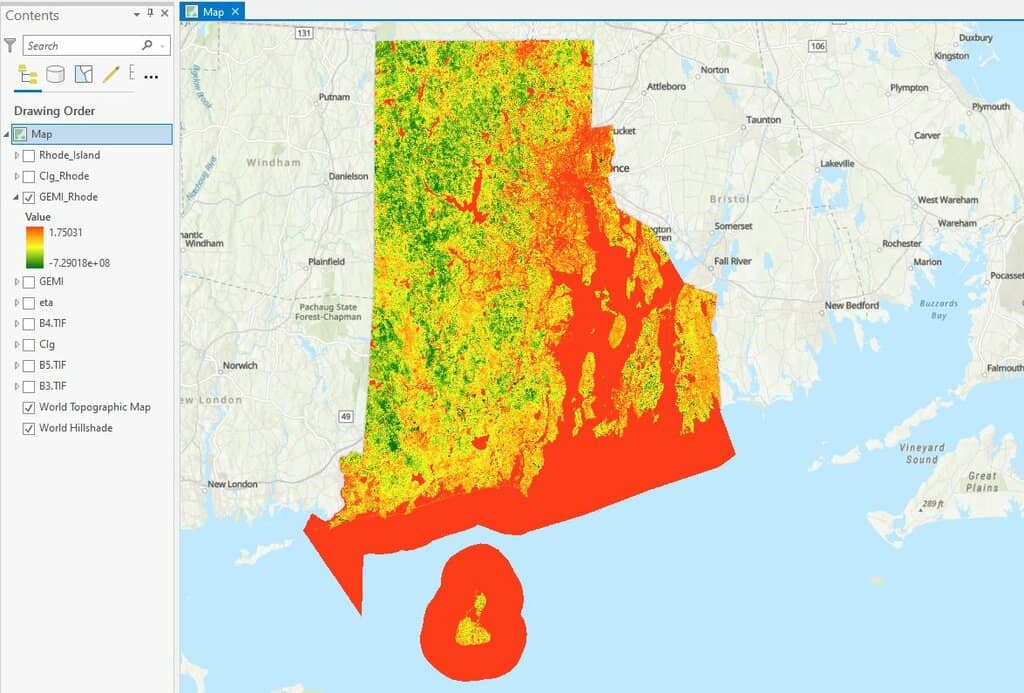
How to use ArcGIS Pro and Landsat 8 Imagery to Calculate Chlorophyll Index and Global Environmental Monitoring Index
Learn to create a chlorophyll index using Landsat 8 imagery in ArcGIS Pro with this step-by-step GIS tutorial.

Remote Sensing for Carbon Offsetting
Remote sensing and geospatial technologies are being harnessed for carbon offsetting efforts.

Mapping Heat Vulnerability from Satellite Data
Satellites are being used to measure heat not only on urban heat islands, but also on farms and other locations where rising temperatures are having an impact.

Mapping the Earth’s Freshwater Bodies
Over 95% of the world's lakes, rivers, and freshwater reservoirs will be measured by a new satellite mission called Surface Water and Ocean Topography (SWOT).

Using Open Source Geospatial Data in Journalism
Geospatial data such as satellite imagery can be used by journalists to verify news stories.

Reliability of Machine Learning Maps
Academics are increasingly adopting machine learning maps to better understand what can happen for a range of environmental events.

Landsat 9 Data Released
Landsat 9 satellite imagery and data has been made publicly available.

Remote Sensing of Lightning
Satellites and remote sensing tools are providing a way to better forecast and determine the severity of lightning.
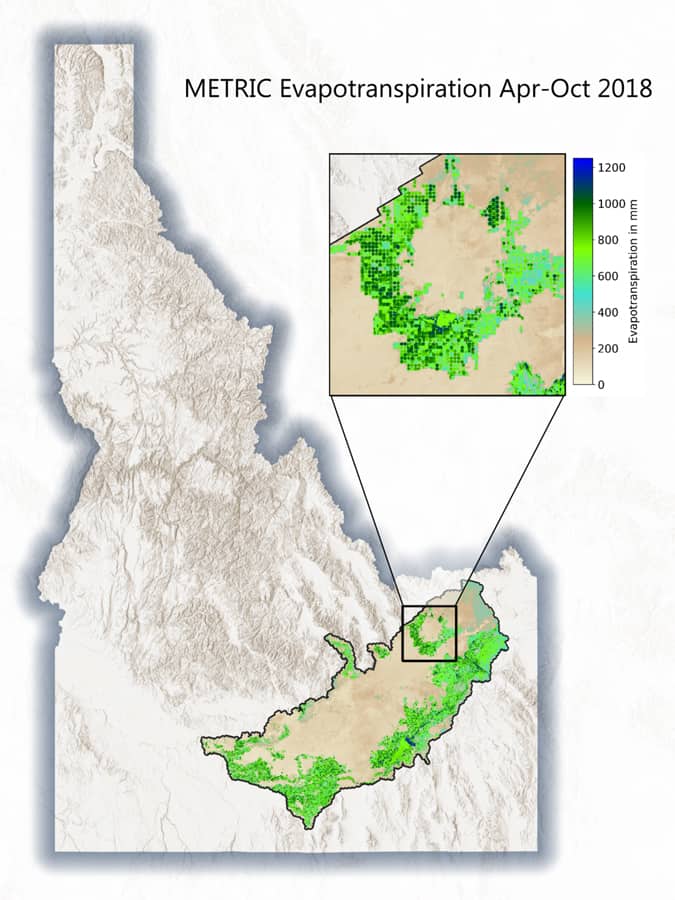
Geospatial Tools for Agricultural Water Management
The use of geospatial technologies can help mitigate inefficient use of water and help improve how this precious resource is used in crop production.

Open-Source Science in the Cloud Collaboration
NASA and the European Space Agency (ESA) released a new open source and science tool called the Multi-Mission Algorithm and Analysis Platform (MAAP).

Mapping Ocean Currents
Mapping ocean currents and understanding how they vary is critical for geographers and scientists, especially as our globe changes.
Mapping Ecosystem Health through Satellite Data
Remote sensing techniques, particularly those based on satellite, drone, and aircraft data, have revolutionized collecting ecosystem data.

How the Satellite Imagery Industry is Re-inventing Itself
Joe Morrison discusses how new businesses are developing tools that use satellite imagery and SAR to quantify climate-related disasters.

Synthetic-Aperture Radar (SAR), Earth Observation, and Mapping
Synthetic-Aperture Radar (SAR) is becoming more widely available and increasingly part of Earth observation satellites.

Hub for Free Remote Sensing Materials
Esri has launched a hub that will serve as the collection point for free remote sensing and imagery materials

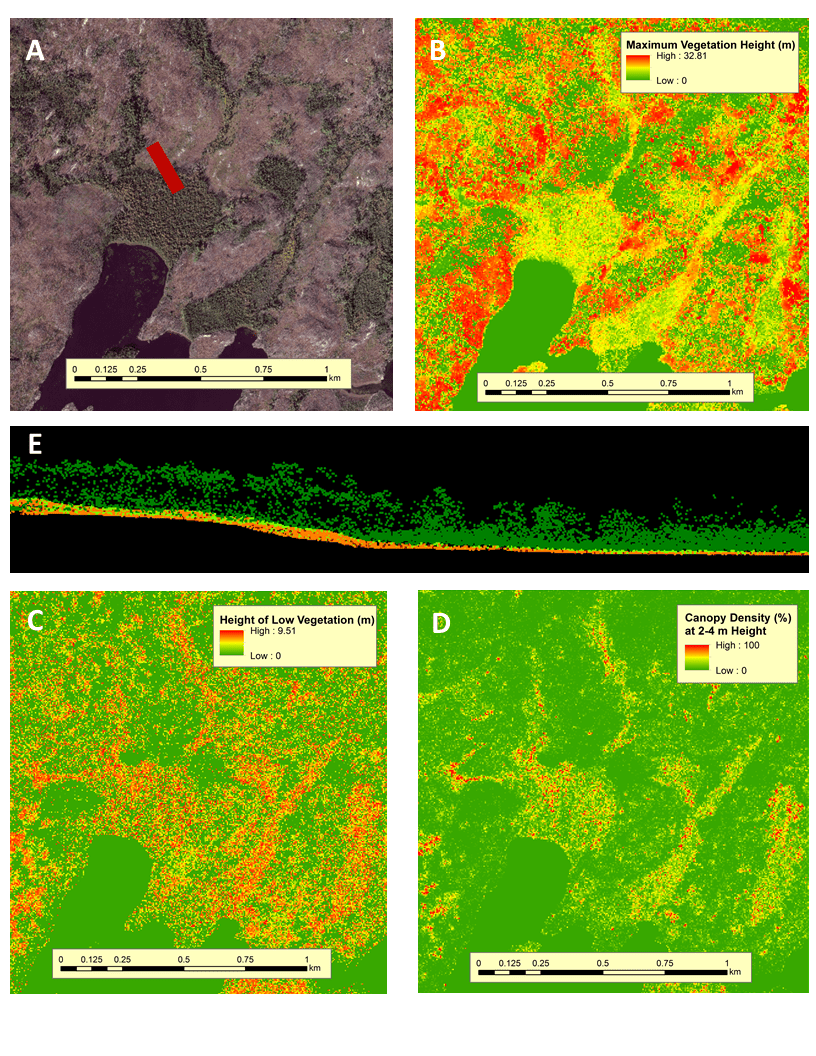
Mapping Tropical Forest Quality from Satellite Data
Researchers have created high resolution maps of tropical forest quality using remotely sensed data from NASA satellites.

Recent Developments in Remote Sensing and Earth Observation
Remote sensing and earth observation capabilities at satellite, aerial, UAV, and ground levels have radically improved in the last decade.
Using Remote Sensing to Map Invasive Species
Scientists and researchers are increasingly using remote sensing methods to map and track invasive species.

Analysis of Satellite Imagery and Search Data Suggests the Coronavirus Outbreak May Have Started Earlier in 2019
A study that analyzed traffic around hospitals using satellite imagery and Baidu search queries suggests that the coronavirus outbreak may have started earlier in China than in December of 2019.