
remote sensing
Monitoring Lakes Using Remote Sensing Data
Satellite-based remote sensing is proving to be a useful tool to allow effective monitoring of lakes around the world.

Satellite Mapping of Oceans and Coral Reefs
In 2018, NASA launched the ICESat-2 satellite to monitor levels of ice. Researchers have found that this satellite can also measure coral reef systems.

Mapping the Universe
New satellite technology achieved in in the last decade are helping scientists to more accurately map the universe.

There are Four Trillion Measurements in this Global Sea Surface Temperature Dataset
Researchers have compiled an enormous global dataset with over four trillion satellite-based measurements of sea surface temperature.

Mapping Plant Stress With Remote Sensing
NASA researchers are able to map out plant stress using a remote sensing from ECOsystems Spaceborne Thermal Radiometer Experiment on Space Station, or ECOSTRESS.
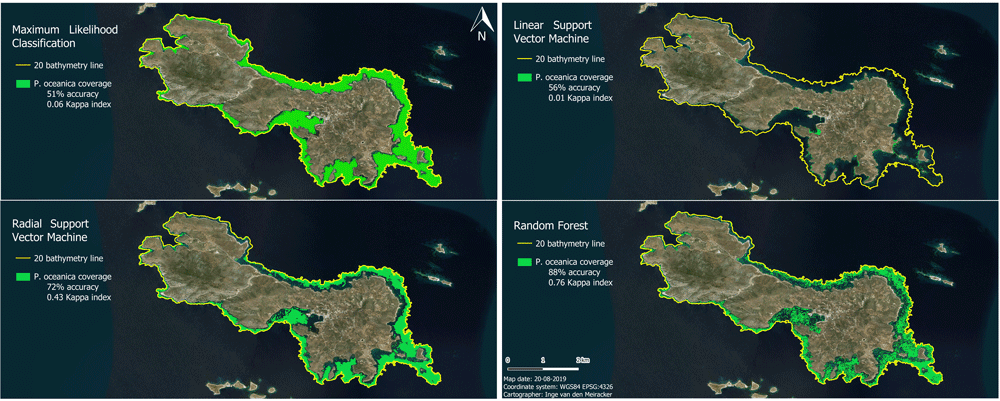
Mapping the Subsea Forests of the Mediterranean
Inge van den Meiracker writes about her research internship in Greece where she modeled and mapped the seagrass distribution in the Southeast Aegean Sea using sonar data, remote sensing techniques, and GIS.

Using Geospatial Analysis to Map the Optimal Places for Tropical Rainforest Restoration
Using peer-reviewed GIS datasets and remote sensing data, 88% of the needed restoration effort could focus on just six countries that are likely to help restore tropical rainforest growth.

What the Rise of Small Satellites Means for Geospatial Data
Small scale satellites are changing how we can acquire our data as geospatial analysts.

New Map Shows How Fast Ice is Leaving Antarctica
Researchers used synthetic-aperture radar (SAR) data to look at how the ice is moving and shifting on Antarctica.

How Google Earth Engine Has Changed Access to Remote Sensing Data
Google Earth Engine provides access to remote sensing data without requiring advanced software or skilled geospatial technicians.

Analyzing the Benefits of Green Space on Mental Health Using GIS
A study in Denmark combined historical Landsat satellite data and a survey to analyze the relationship between green space and mental health.
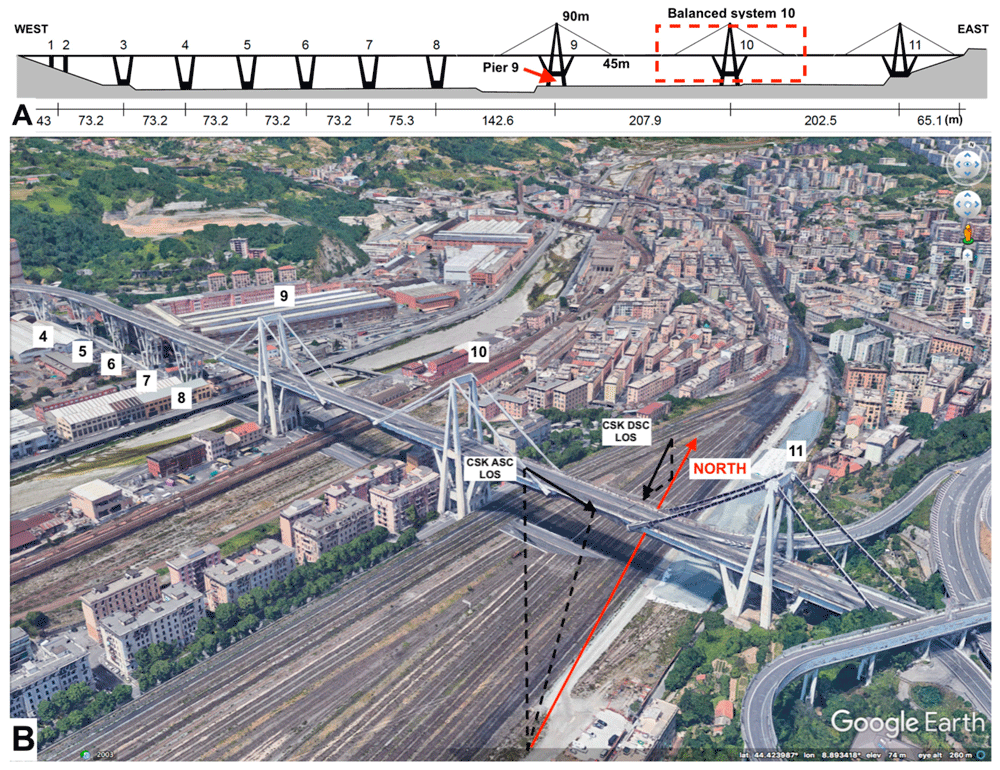
Using Remote Sensing to Detect Structural Changes in Bridges
Researchers are using synthetic aperture radar (SAR) collected from satellites to detect structural changes in bridges.

Real-time Fire Mapping and Satellite Data
New satellites and improved image processing methods are better enabling the ability to provide real-time and near real-time mapping of wildfires.

Free Synthetic Aperture Radar Handbook Available
This free handboo provides insight into how different Synthetic Aperture Radar (SAR) methodologies can be used for forest monitoring and biomass estimation.

LandViewer Has Added New Remote Sensing and Satellite Imagery Analytics
This article by EOS, a company which creates solutions for Earth observation imagery processing and analysis, introduces a host of updated capabilities in its LandViewer tool.

ICESat-2: Highest Resolution Laser Altimeter
ICESat-2's purpose is to collect detailed measurements of the Earth's surface using its Advanced Topographic Laser Altimeter System (ATLAS).

Mapping Where Norway is Moving
Norway is using Copernicus Sentinel-1 data to detect ground movement across the country.

PACE: NASA’s Earth Observation Satellite to Launch in 2022
NASA’s PACE (Plankton, Aerosol, Cloud, Ocean Ecosystem) is a planned earth observation satellite with an anticipated launch in 2022.

Forecasting Cholera Using Remote Sensing
The NASA cholera forecasting tool effectively takes satellite observations on environmental conditions and combines the data with information on infrastructure and conditions in a country.

Mapping Tree Species in the Amazon Using Satellite Imagery and Machine Learning
Researchers have modeled tree species distribution in Peruvian lowland Amazonia using satellite imagery and machine learning techniques.

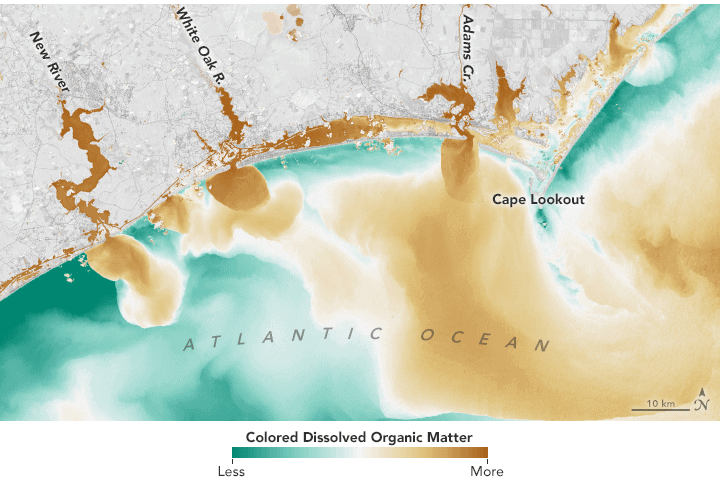
Ready for Summer – Remote Sensing of Bathing Water Quality
Remote sensing is being used to help researchers monitor water quality in lakes and coastal areas.
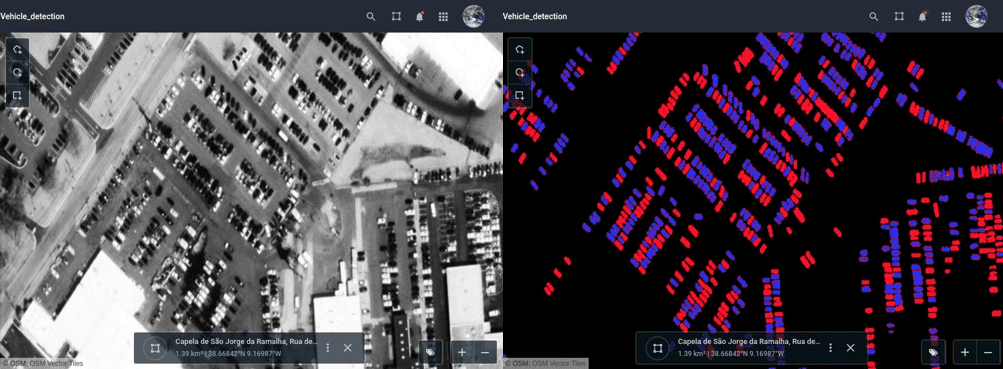
Run Image Processing Tasks in Your Browser with the EOS Platform
This guest article by EOS introduces the newly upgraded EOS platform, a set of mutually integrated cloud products for searching, analyzing, storing, and visualizing geospatial data: Landviewer, Processing, Vision, Storage.

Monitoring and Mapping Microplastics in Marine Ecosystems
Advancements in satellite remote sensing techniques are paving the way toward the development of high resolution and temporal maps of marine microplastic distribution.

Mapping Minerals with Satellite Imagery
Mapping minerals with remote sensing was one of the main motivating reasons for creating the earliest multispectral satellite systems.

Monitoring Algal Blooms with Remote Sensing
Given the importance of knowing how blooms affect aquatic life, remote sensing techniques using a variety of available imagery have been developed.
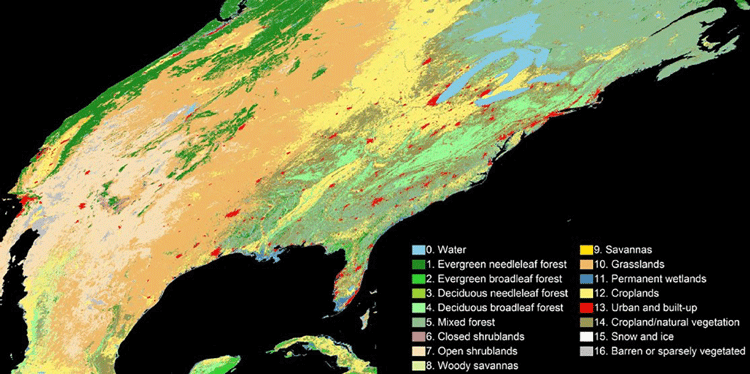
An Algorithm to More Accurately Classify Land Cover Using Landsat Imagery
Hankui Zhang, from South Dakota State University, has developed a new classification technique that combine satellite images from MODIS and Landsat.