
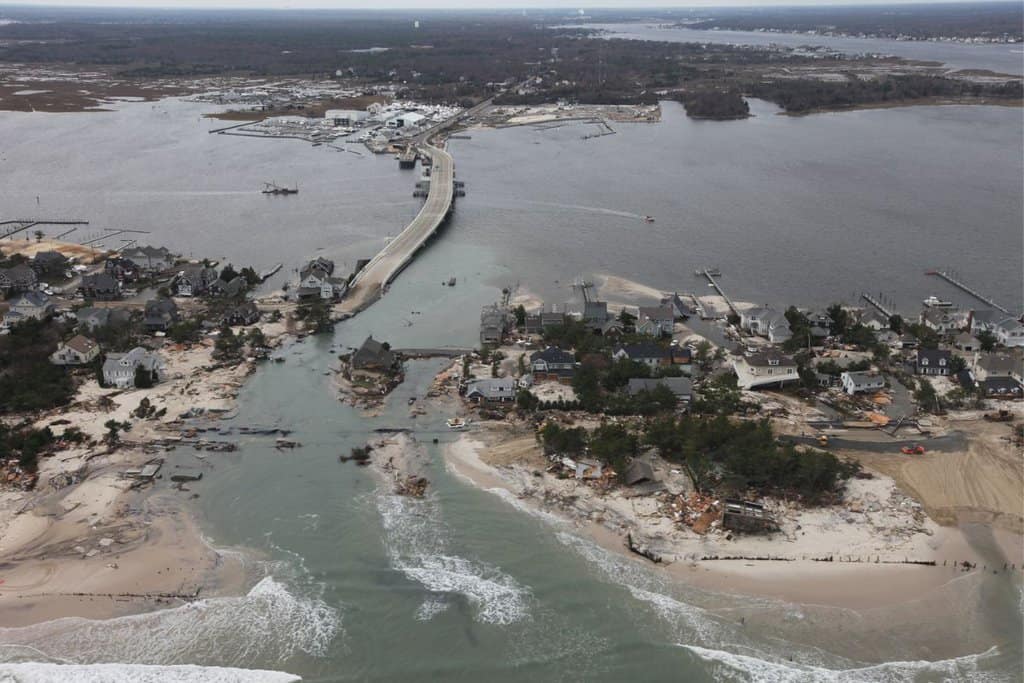
We saw recently with major hurricanes, such as Hurricane Ian, that people can become easily trapped as rising floodwaters may lead to some areas being inundated. Furthermore, damage from hurricanes, such as debris strewn along roads, could also hinder search and rescue efforts.
Now, using satellite data and artificial intelligence, researchers have developed a way to potentially pinpoint where people might be trapped after a hurricane and provide relief to them quickly while monitoring a wide area such as an entire state.
Mapping before and after hurricane disasters
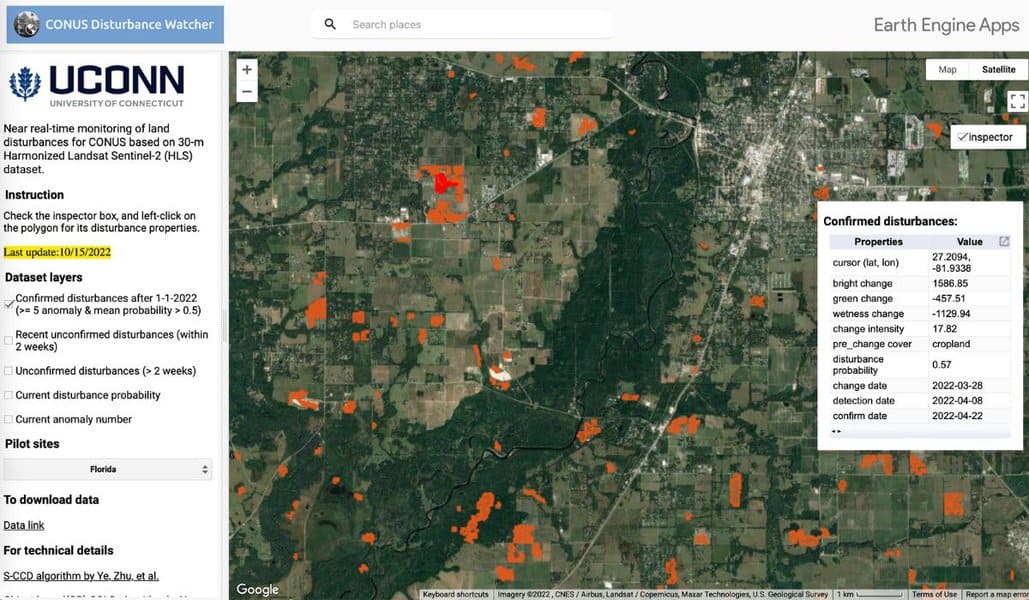
Using imagery and sensor data from before and after a given storm, researchers can compare broad areas at 30-meter resolution using existing public satellite systems.
Imagery for given areas from before a storm are compared to after storm images and anomalies differentiated by an algorithm, called Stochastic Continuous Change Detection (S-CCD), helps to detect areas that appear significantly different.
This allows recursive monitoring of a region and enabling temporal dynamics of satellite imagery to be updated on maps and disturbance displays. Anomalies spotted include water or sand displaced or transported to an area, which are likely to happen during a major hurricane.
Change detection using satellite imagery and algorithms
Damage can also be spotted, such as roofs ripped off or changed in appearance of a neighborhood after a storm. Such damage affects image reflectance, registering a change in one image scene to another. In addition, the intensity of that change also is registered and major changes in intensity are also recorded as an affected area on maps.
In summary, if a given area looks clearly different, then on a display map it would appear as a changed area where damage is present.
86% accuracy in identified damaged areas after a hurricane
Overall, testing the algorithm on identifying damaged areas or areas with significantly different appearance, showed that 86% of affected areas in Hurricane Ian were identified.
Using near real-time satellite imagery to map hurricane damage
Currently, the system has used data from Landsat 8 and Landsat 9 as well as Sentinel 2A and 2B.
The main drawback of this method is relying on these satellites mean that data are not released until a few days after a given event. However, researchers are now attempting to develop this approach using near real-time satellite data by working with relevant authorities and satellite companies.
The advantage of this approach versus using drone or other obtained imagery is it gives very broad coverage, which allows major disasters such as hurricanes to be more easily covered. Rescue teams could theoretically better target their searches by going to places that appear affected significantly by storm damage.[1]
COntinuous monitoring of Land Disturbance (COLD) algorithm
The algorithms used for this work build from previous land disturbance modelling using the COntinuous monitoring of Land Disturbance (COLD) algorithm. This technique is also useful for finding disturbed areas without having to depend on training data.
Omission errors in this approach are less than 30%, which means disturbed areas are very likely to be detected from one scene to another. However, the main difference is that the S-CCD method is a faster technique, at about 4.4 times the speed of COLD, which enables larger scenes to be covered more quickly.[2]
If time is an important variable for rescue teams, potentially S-CCD could give some advantages.
Both techniques also use multiple spectral bands and depend on reflectance data to inform on land cover change. The techniques could also be used for general monitoring for land use change and disturbance not related to storms; both methods demonstrate that they can be used for alerting authorities to highly damaged areas after storms.
Object-based Disturbance Agent Classification Approach (ODACA)
Another similar algorithm is the Object-based Disturbance Agent Classification Approach (ODACA) algorithm, which has shown accuracy close to 99%; however, this algorithm has been mainly used to monitor agriculture-related land use, fire, and hydrologic change rather than hurricane or storm damage.[3]
The COLD, ODACA, and S-CCD algorithms are yet to be tested by authorities in hurricane response. So far, they have been used as research demonstrations or areas outside of hurricane or disaster relief.
Ideally, dedicated satellites that monitor regions for weather-related damage can be used in near real-time if these algorithms are to be used for rapid rescue. This will require future close coordination between authorities, satellite providers, and rescue officials trained to use and interpret such algorithms that identify land disturbances.
References
[1] For more on this approach using satellite data and an artificial intelligence algorithm to indicate damaged or changed areas, see: https://theconversation.com/new-satellite-mapping-with-ai-can-quickly-pinpoint-hurricane-damage-across-an-entire-state-to-spot-where-people-may-be-trapped-192078. A map showing results from Hurricane Ian can be found here: https://gers.users.earthengine.app/view/nrt-conus. Additionally, the algorithm is discussed in greater detail here: Ye, Su, John Rogan, Zhe Zhu, and J. Ronald Eastman. 2021. ‘A Near-Real-Time Approach for Monitoring Forest Disturbance Using Landsat Time Series: Stochastic Continuous Change Detection’. Remote Sensing of Environment 252: 112167.
[2] For more on the COLD algorithm, see: Zhu, Zhe et al. 2020. ‘Continuous Monitoring of Land Disturbance Based on Landsat Time Series’. Remote Sensing of Environment 238: 111116.
[3] For more on ODACA, see: Qiu, Shi, Zhe Zhu, and Xiucheng Yang. 2022. Characterization of Land Disturbances Based on Landsat Time Series. Information and Computing Sciences. preprint. https://www.essoar.org/doi/10.1002/essoar.10511010.1 (October 16, 2022).