Globalization has led to the integration of several socio-economic, environmental, and physical sciences to bring eco-sustainable development. Digital technologies have helped immensely by connecting and bringing several scientific backgrounds together for inter-industrial development.
GIS and remote sensing technologies combine several geographically scientific concepts to capture and process data to bring innovation in government, engineering, business, health, safety, and environmental industries.
In recent times, drone technology forms one of the widely used tools for data capture. During data capture, a LIDAR sensor is sometimes attached to a drone to serve land use monitoring and management purposes.
Although there are several application areas to be explored in the LIDAR environment, LIDAR data has shown initiative by effective mechanisms in finding solutions to several existing problems in the construction, agriculture, mining, and archeology industry today.
Specifically, LIDAR has been used to map soil for soil quality assessment to predict crop yields and plan crop planting in Agriculture, assess terrain elevations during construction projects, locate ancient monuments, and create Digital Elevation Model (DEM) for terrain management and assessment, among many others.
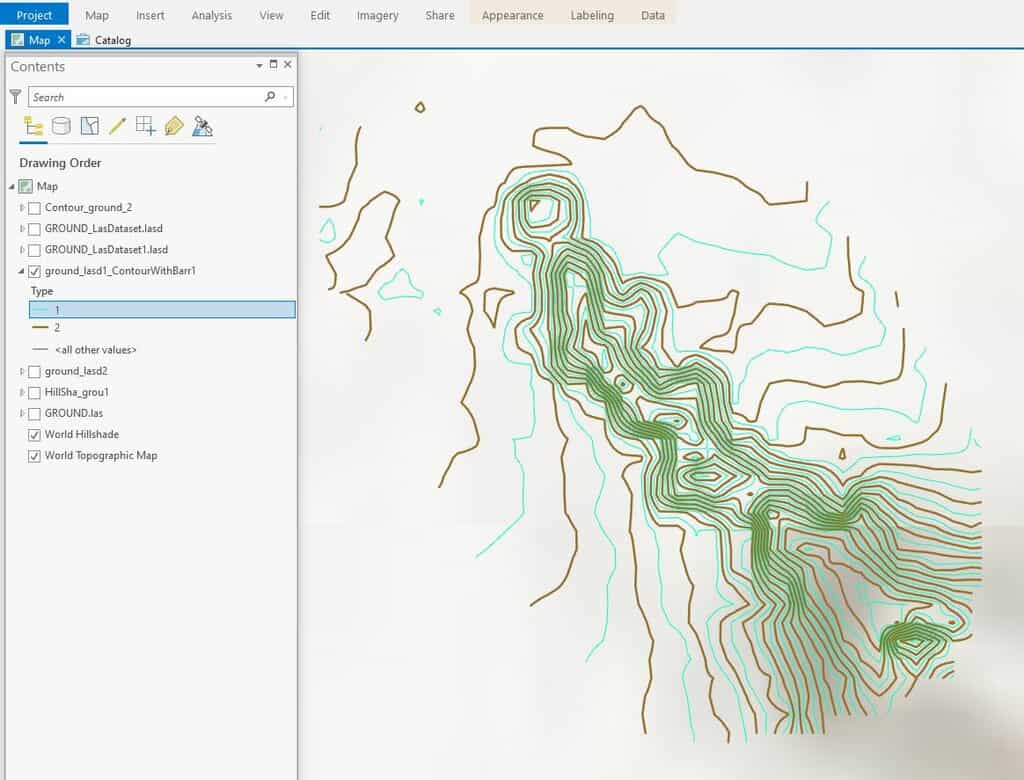
As a result, this tutorial contributes to the many terrain assessments, modeling, and monitoring measures by outlining steps on how to use ArcGIS Pro to extract contours from LIDAR data. Some geoprocessing tools used in the process are slope, elevation, hillshade, create LAS dataset, LAS Dataset to raster, contour, and contours with barriers.
Figure 1 shows a summary of the methodological flow employed in the study.

Accessing LIDAR Data
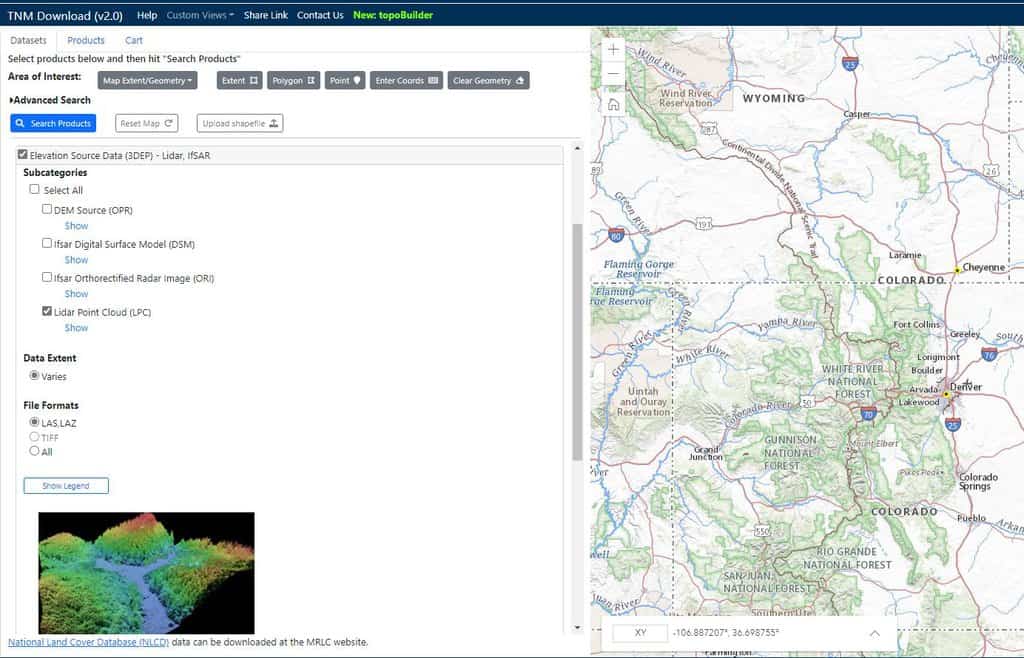
Free LIDAR data can be accessed from the National Map’s website.
- From the options available, select “The National Map (TNM) client.”
- From the web interface, set the spatial extent to area of choice where contours would be extracted.
- Set the specifications for the LIDAR data to be accessed, from the Data tab and click “search products.” Be sure to set the data format of the LIDAR data to “LAS.”
- Based on the LIDAR data available for the area of interest, several options area given.
- Select the link to begin the LIDAR data acquisition process.
Exploring LIDAR data in ArcGIS Pro
To import LIDAR data into ArcGIS Pro:
- Open ArcGIS Pro, and create a new project from the “project” tab by selecting “map.”
- To import the LIDAR data onto the map canvas, click on the “Add data” tool.
- Navigate to the location of the LIDAR data to import.
Where the LIDAR data refuses to show up on the map canvas, the following alternative can be used:
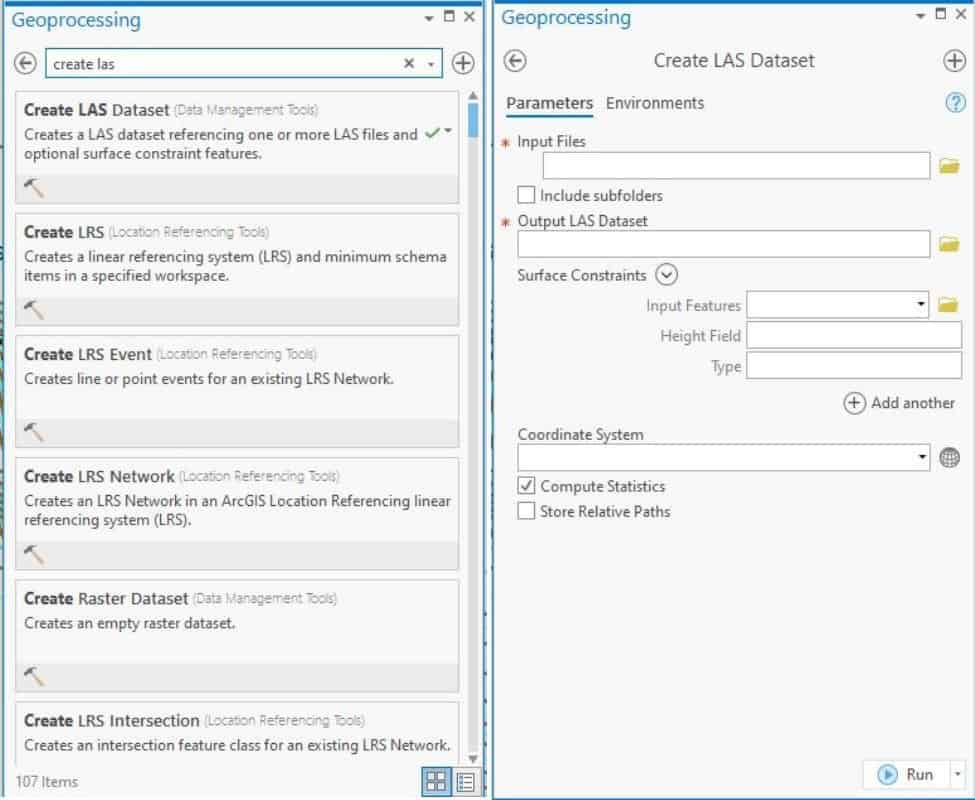
- From the search bar of the geoprocessing toolbox, type and search, “Create LAS Dataset.”
- Set input files to LIDAR data.
- Set “Output LAS Dataset” to the desired output name and location.
- Ensure that the coordinate system is set and not blank.
- Click “Run.”
Visualizing LIDAR data in ArcGIS Pro
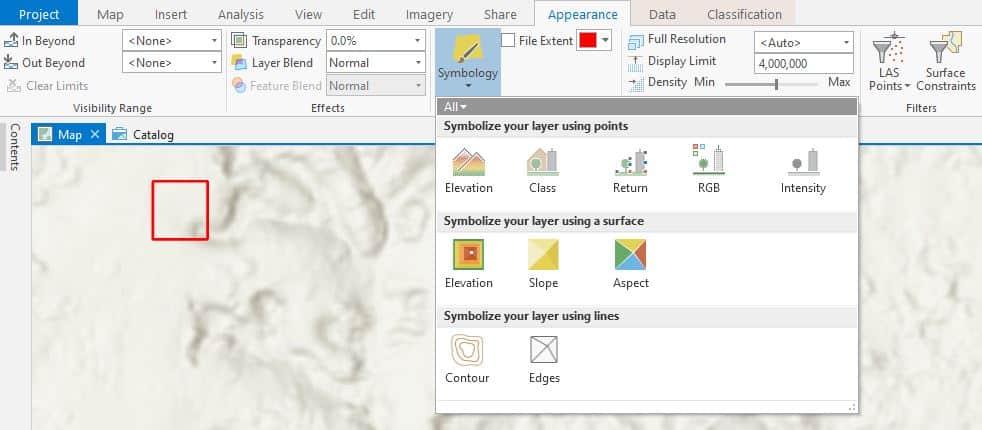
To explore and visualize the LIDAR data in ArcGIS Pro, use the outlined steps below:
- From the Appearance tab of the menu bar, select the drop-down menu from the Symbology tab.
- Select “Elevation” from the drop-down to visualize the elevation of the area. ArcGIS Pro uses the natural breaks method to set the elevation data into a default number of classes for visualization.
- To visualize the “slope” of the area, select “slope” from the drop-down of the Symbology tab. A default number of classes is given which can be manually changed for visualization.
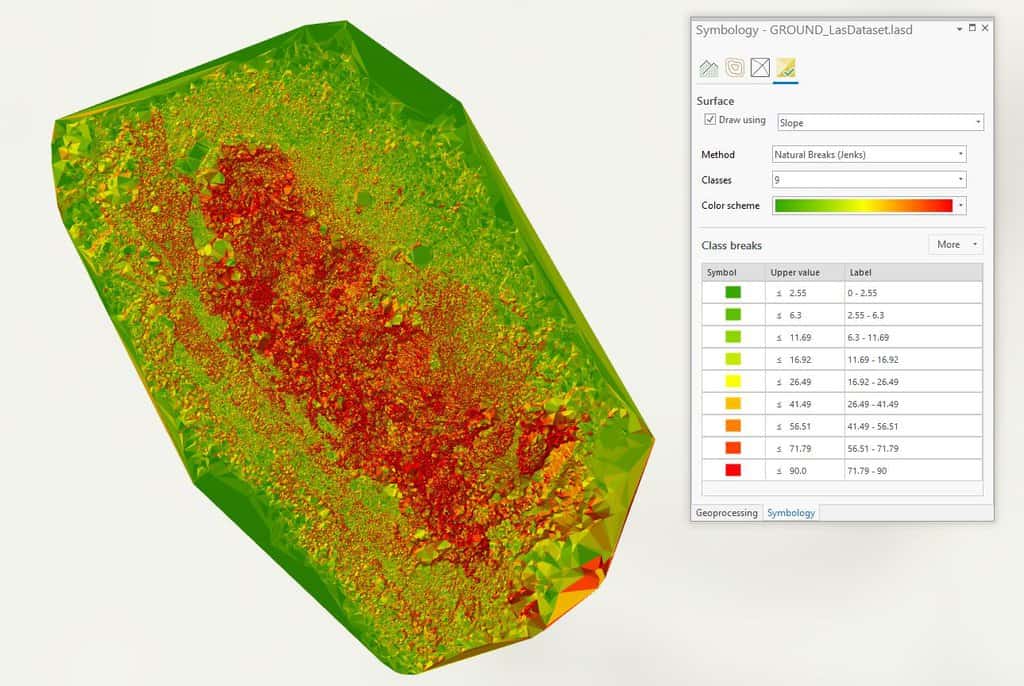
To explore the contour, elevation, and aspect of the study area, repeat step 3 or 2 above.

Creating Hillside and Contours in ArcGIS Pro
To rasterize the LIDAR data:
- From the search bar of the geoprocessing toolbox, type and search, “LAS dataset to raster.”
- Set “input LAS dataset” to the created LAS file.
- Set “output raster” to the desired name and location of the output file.
- Click Run.
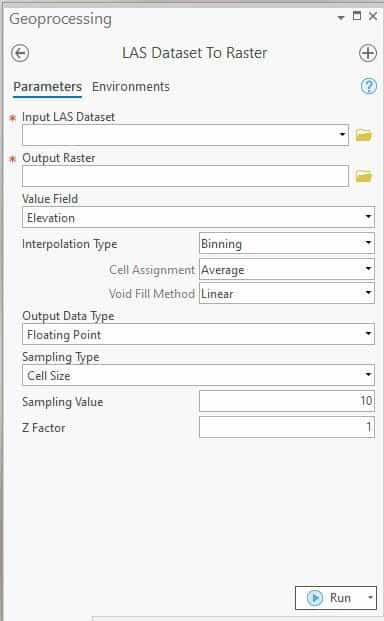
Create Hillshade from LIDAR
To create Hillshade from the LIDAR data in raster format;
- From the search bar of the geoprocessing toolbox, type and search, “Hillshade.”
- Set “input raster” to LIDAR data in raster format.
- Set “output raster” to desired name and location of the output.
- Click Run.
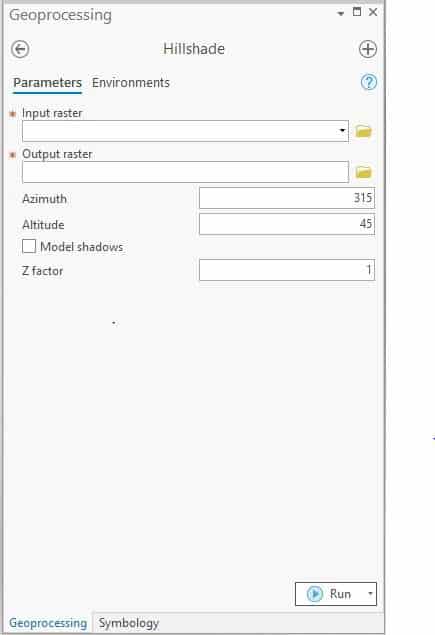
Create Contours in ArcGIS Pro from Lidar
To create contours from the LIDAR data in raster format;
- From the search bar of the geoprocessing toolbox, type and search, “contour.”
- Set “input data” to LIDAR data in raster format.
- Set “output feature class” to desired output name and location.
- Specify contour interval.
- Click Run.
To create index contours:
- From the search bar of the geoprocessing toolbox, type and search, “contour with barriers.”
- Set “input data” to LIDAR data in raster format.
- Set “output contour features” to desired output name and location.
- Specify “contour interval” and “indexed contour interval.”
- Click Run.
To symbolize the index contours:
- Right-click on the layer for the results of “contours with barriers.”
- Select symbology and set “Primary symbology” to “unique values.”
- Set “Field 1” to type.
- Select “type 1” and set line width for “type 1” to 0.8.
- Select “type 2” and set line width for “type 2” to 2.
- Click Run.
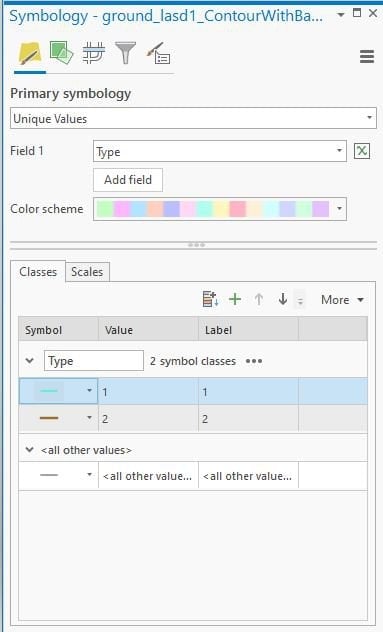
Symbolized Topography Contours in ArcGIS Pro
