
Remotely-sensed imagery from aircraft and satellites represent one of the fastest-growing sources for raster GIS data. While remote-sensing technology has been around for decades, recent technological advances and legislative changes have led to an dramatic increase in the types of imagery available. In the U.S., due to recent legislative changes and the repeal of the Landsat Commercialization Act, these data can now be obtained at costs well below previous levels.
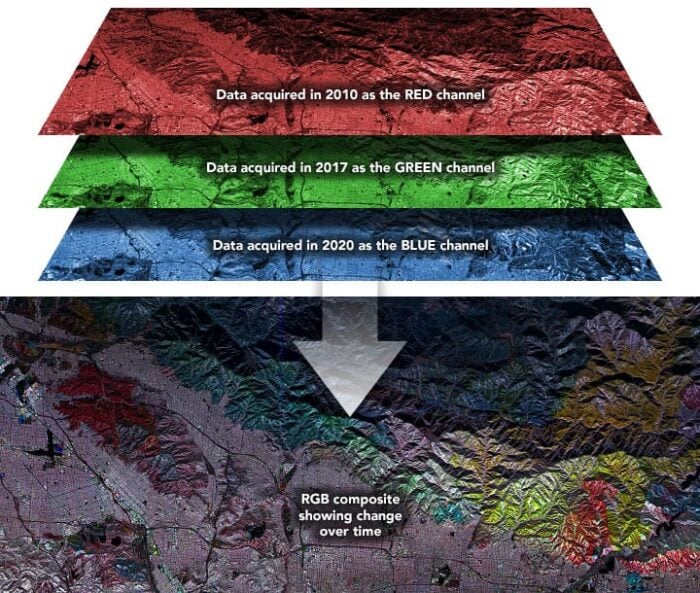
Satellite imaging has now been around long enough to allow study of temporal changes on the land surface. For example, early Landsat images beginning in 1972 can now be compared with recent observations, providing a 25+ year record of land-use, vegetation, and urban change.
Passive and Active Remote Sensing
Remote-sensing technologies come in two flavors: Passive remote sensing relies on naturally reflected or emitted energy of the imaged surface (think of taking a photograph with a camera under sunlit conditions). Most remote sensing instruments fall into this category, obtaining pictures of visible, near-infrared and thermal infrared energy.
Active remote sensing means that the sensor provides its own illumination and measures what comes back (think of a camera with a flash). Remote sensing technologies that use active remote sensing include lidar (laser) and radar.
How Imaging Systems Differ from Camera Photography
Imaging systems differ significantly from camera photography in two important ways. First, they are not restricted only to “visible” part of the electromagnetic spectrum (so named because it is the range over which the human eye can see, from about 0.4 to 0.7 micrometers in wavelength). It also can measure energy at wavelengths invisible to the eye, such as near-infrared, thermal infrared and radio wavelengths.
Second, most remote sensing instruments record these different wavelengths at the same time, yielding not one but numerous images of the same location on the ground, each corresponding to a different range of wavelengths (called a “band”). For example, the Enhanced Thematic Mapper instrument on the Landsat-7 satellite (launched by NASA in 1999) has seven bands in the visible, near-infrared, mid-infrared and thermal-infrared wavelengths, as well as a fine-resolution “panchromatic” band that collects over all wavelengths. Therefore, a single Landsat-7 “image” is in fact comprised of eight separate images or bands, each corresponding to a different part of the electromagnetic spectrum. During image analysis of these data, each band is treated as a layer in a raster GIS.
Passive visible and near-infrared data are used in a variety of GIS applications. Classification of vegetation and land-use is particularly common, and may be performed at a variety of temporal and spatial scales. Most earth imaging satellites or polar-orbiting, meaning that they circle the planet in a roughly north-south ellipse while the earth revolves beneath them. Therefore, unless the satellite has some sort of “pointing” capability, there are only certain times when a particular place on the ground will be imaged.
The length of time between imaging can be short (~daily) or long (~once per month or even longer), depending on the satellites design. In order to have frequent temporal coverage, the sensor must image a wide swath of ground beneath the satellite. Unfortunately, this also means that spatial resolution, (i.e. the size of the smallest imaged element on the ground) must be coarse in order to image such a large area at once.
Therefore, most passive remote sensing data possess a trade-off between frequent, global coverage with coarse spatial resolution; or infrequent coverage with a high spatial resolution. Because applications vary in their spatial and temporal resolution requirements, a variety of sensors exist to meet these needs. For example, the Advanced Very High Resolution Radiometer (AVHRR) has 1.1 km pixels, but images are 2400 km wide and collected every 12 hours. Landsat-7 provides high spatial resolution (15-30 m) but obtains an image less than 200 km wide only once per month. The new IKONOS satellite (launched by Space Imaging in 1999) has an even higher spatial resolution (~4 m). However, the resulting images are only 11X11 km in size and are obtained infrequently or by special request.
Since the launch of the ERS-1 Synthetic Aperture Radar (SAR) satellite in 1991, active remote sensing (radar and lidar) systems are rapidly increasing in availability. Radars are sensitive to very different surface properties than visible/near-infrared imagery. For example, rather than vegetation “color,” radar images are sensitive to the moisture content in leaves and their shape, orientation and size. In the last five years, airborne lidars have seen increasing use for mapping surface topography in three dimensions. Existing and planned radar and lidar altimeters will monitor closely the elevation of the worlds ice caps and sea level with centimeter precision.
Image processing software designed for analysis of remotely sensed data is really a specialized form of raster GIS. While it is possible to manipulate these images in mainstream raster GIS software such as ArcInfo GRID, IDRISI and GRASS, most technicians use software specifically designed to work with data formats for satellite and aircraft imagery, such as PCI, ENVI, ERDAS IMAGINE, and ERMapper. These packages are specifically designed for remote sensing applications and and provide a wide array of tools for image filtering, classification, annotation and texture analysis.
About the Author
Dr. Laurence Smith is an assistant professor with the Geography Department at the University of California, Los Angeles. He also holds a joint appointment with the Department of Earth & Space Sciences. His research interests of hydrology and remote sensing have lead him to studies in Iceland and Russia.