
Geo Contributor
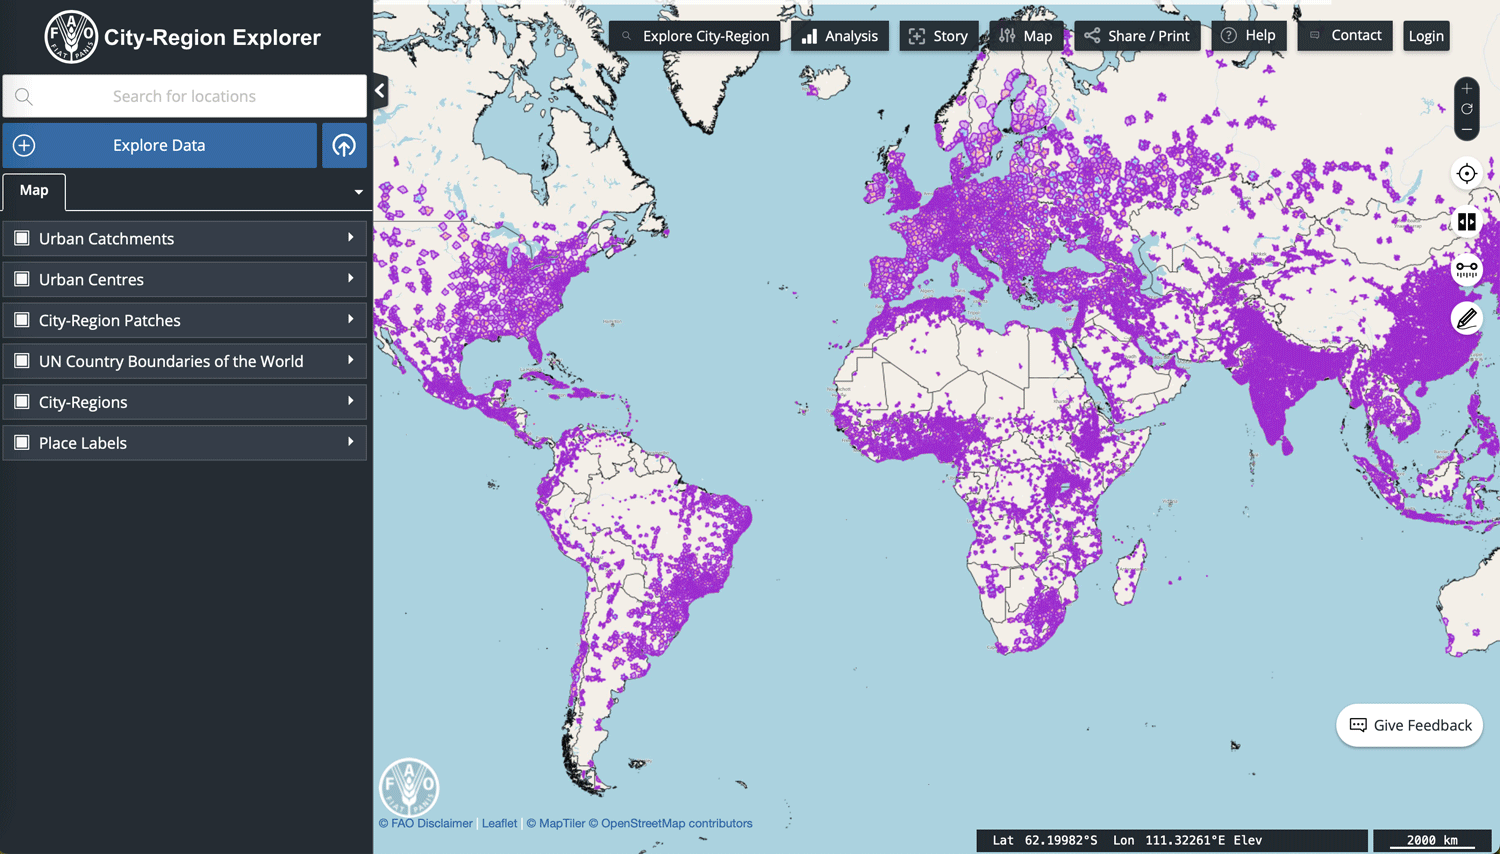
How the FAO’s City-Region Explorer Maps Urban Connections
Explore the FAO's City-Region Explorer to see how GIS maps connections between cities and surrounding communities.
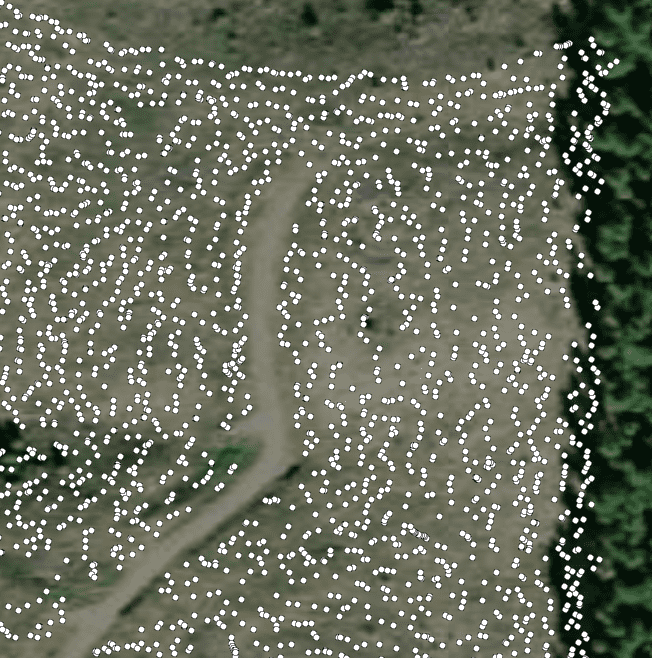
Mapping Trees During Planting
STA Logger, developed by TerraLab, can be fitted with tree planters to map the location of newly planted trees.

GIS Data: A Look at Accuracy, Precision, and Types of Errors
What are the types of error found in GIS data? This article reviews the difference between accuracy and precision and explains the most common types of error found in GIS data.

Finding GIS Data and Using QGIS to Map Caves
Dackery Geiman outlines the challenges he encountered finding geospatial data about caves and using QGIS to map cave density in Missouri.

GIS in Land Use Planning and Surveying
Michael Parks explains how he used GIS data and imagery to develop geospatial analysis and maps to recommend potential base camp sites.

Using GIS to Map Fly Fishing Destinations
William Bakemeyer describes how he used QGIS and open source data to create a fly fishing map.

QGIS from a Graduate Student’s Perspective
Kent Campbell writes about how he has come to view the benefits of using QGIS as a graduate student.

Crowdsourcing Archaeological Data with Participatory GIS
People with little or no training in archaeology or geographic computing systems can build GIS data using Humap's Placemaker.

FABDEM: 30 Meter Resolution Bare Earth DEM from Fathom
FABDEM is the first global Digital Elevation Model (DEM) with forests and buildings removed at a 30m resolution.

The State of GIS Jobs in 2022
Andres Abeyta, Director of Bootcamp GIS reports about the state of GIS jobs as he looks at what skills and experiences job seekers need.

Fluid Earth: Open-source Visualization of Weather and Climate Data
Fluid Earth is a web visualization tool developed by The Ohio State University's Byrd Polar and Climate Research Center (BPCRC) that enables users to view weather and climate patterns.

Mapping the Sounds of the Ocean
Using hydrophones, scientists convert sound waves to electrical signals to create images of underwater ocean environments.

The Many Uses of Aerial Imagery
Nearmap's Tony Agresta outlines the many applications of aerial imagery, including assessing damage after a disaster, reducing crime, valuing properties, and more.

The Role of UX and UI in GIS
Jeff Siarto of Element 84 talks with the MapScaping Podcast about the evolving role of design in the geospatial industry.

A Look at 3 Trends Shaping Remote Sensing in the Next 5 Years
Ian Berdie of NV5 Geospatial, discusses three trends that will reshape use of remote sensing over the next five years.

AI-assisted Mapping of Crop Fields Using Free Sentinel Imagery
Mapflow offers an AI-driven process to map crop fields in QGIS.
How to Create a Time-lapse of Satellite Imagery With Google Earth Engine and Streamlit
Qiusheng Wu explains how to make a 60-second satellite timelapse of any location on the globe.
A Guide to Building Interactive Google Maps with R Shiny
Dario Radečić demonstrates how to build interactive Google Maps with R, and how to include them in R Shiny dashboards.

How to Create Firefly Cartography with QGIS
Firefly cartography is a cartographic style used to create maps that glow. Learn how to make a firefly map using QGIS.

Mentoring in the Geospatial Industry
Opeyemi Kazeem-Jimoh of the Geospatially Africa Podcast spoke to Sharon Omoja, a regional ambassador for Women in Geospatial+ about her personal experience in volunteering and mentoring women in the geospatial industry.

Enhance Your GIS Opportunities in Africa
Olufemi Damilola from Africa GeoConvo Podcast discusses information about employment options as a GIS enthusiast or student, as well as a curated list of African organizations that employ GIS practitioners.

How Did Ida Turn Into Such a Strong Hurricane?
Oceanographer Nick Shay explains how eddies, part of what’s known as the Loop Current, help storms rapidly intensify into monster hurricanes.
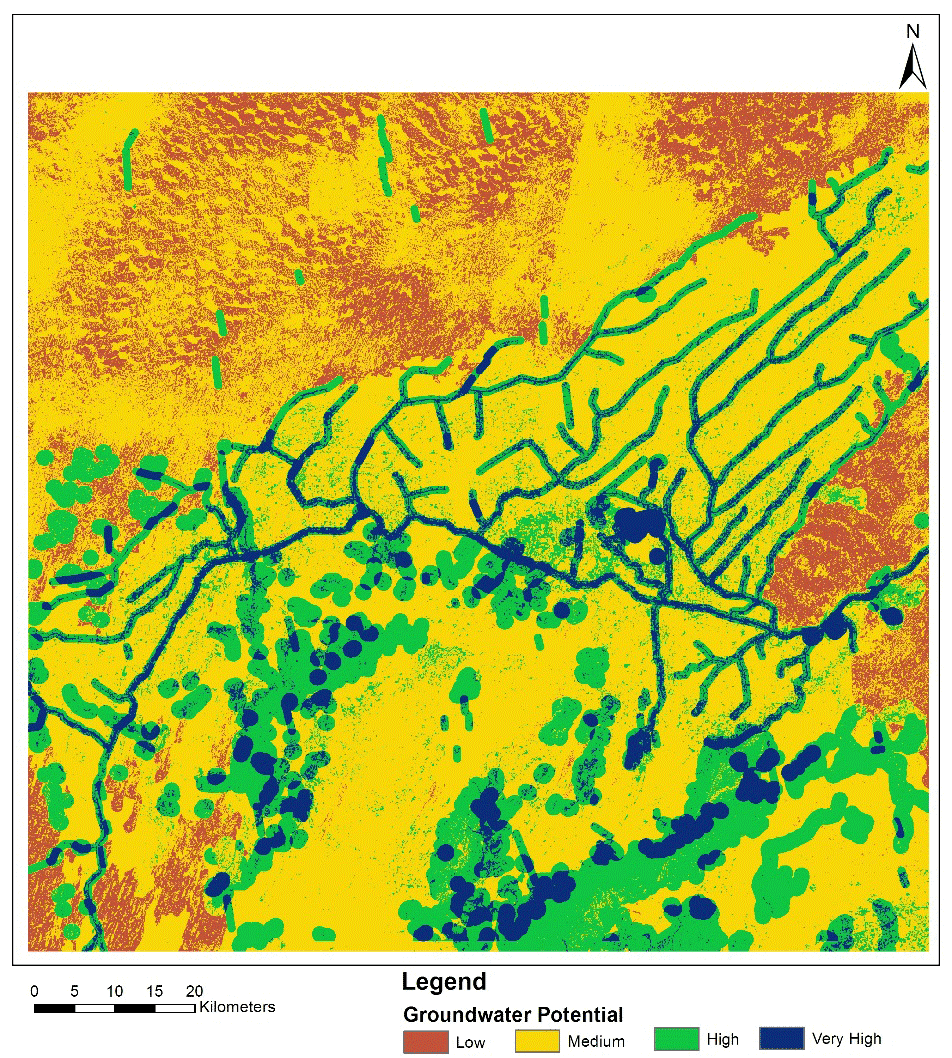
Mapping Groundwater Potential in a Desert using Geospatial Technology
Anindita Ghosh discusses her study that used GIS tools and analysis to map out areas with groundwater potential in a desert.
4 Things to Learn About Hurricane Ida
These four resources explain why the New Orleans area is at high risk for severe hurricanes and what role climate change plays in these devastating storms.
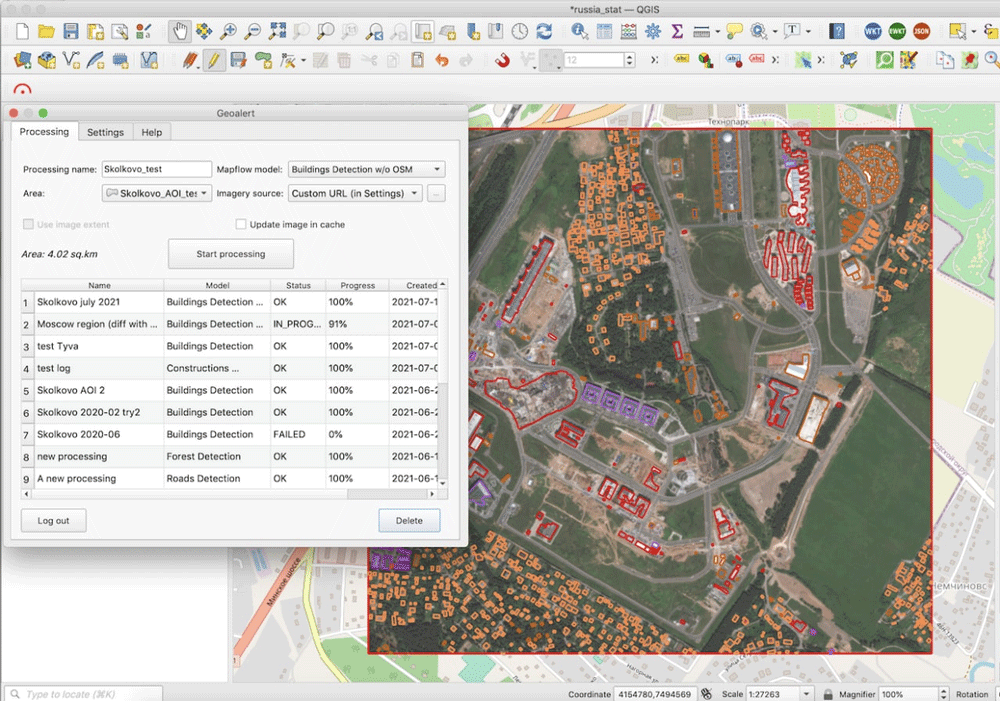
Run AI-Mapping in QGIS over high-resolution satellite imagery
Mapflow is a QGIS plugin that lets users extract real-world objects from satellite imagery.

Open-Source Web-GIS Development Roadmap
This article will provide a step-by-step learning guide to support your Web-GIS development journey, based on the authors' years of experience and extensive research.