
Are you one of those readers who have never even heard of a Geographical Information System until recently like myself? Well, you have come to the right place because I am about to tell you all about QGIS from a graduate student’s perspective.
Prior to my graduate program, I knew that satellites were able to scan and take images of the earth, and that analysts behind the scenes were evaluating them. But did you know that some sources of satellite imagery are free and available to the general public?
You can access satellite imagery from various platforms such as Landsat 8 through websites like the USGS’ EarthExplorer and look at them in a free software called QGIS.
For most beginners in QGIS, it may seem overwhelming to navigate the software for the first couple of times. But once you get through a few projects, understanding the tools within the software is pretty straight forward.
Through my limited experience using QGIS, I have come to realize that what a user can do is limitless. You can create maps of anywhere on Earth, analyze imagery, solve work related problems, incorporate real time information, personalize the housing market, sketch out project ideas, use combinations of both raster and vector layers, and the list really does go on and on.
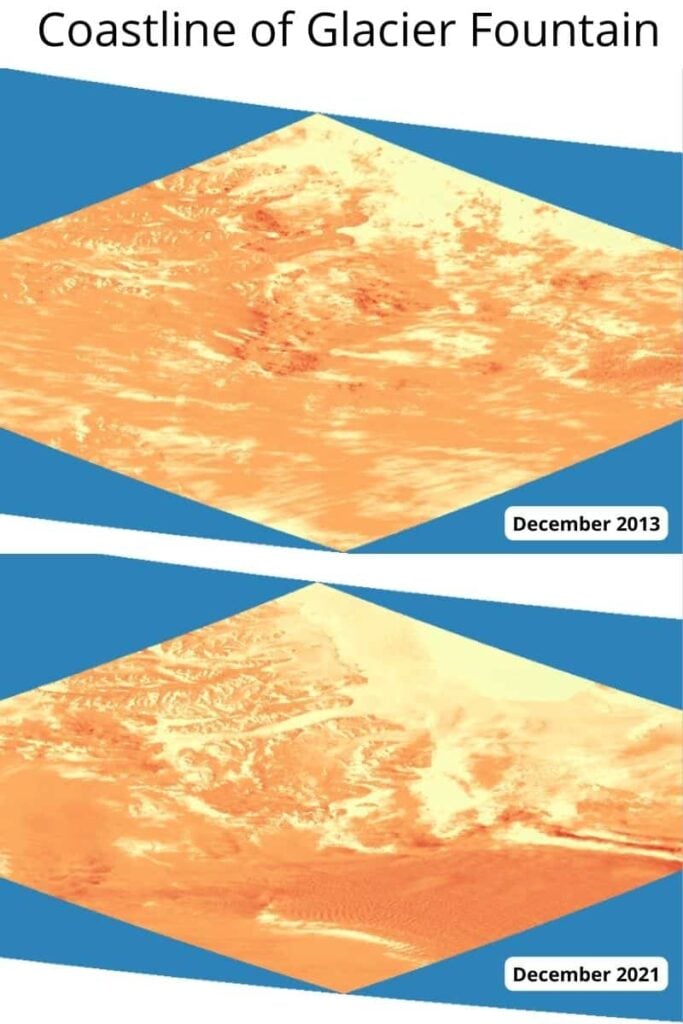
To better illustrate QGIS from a graduate student’s perspective, I will show you some images I have produced to analyze polar ice changes.

The images above clearly show that there is a difference today in the amount of ice and snow. The yellow represents the ice off the coastline, and the orange represents the snow that is more inland. With this simple pseudo color image created from the SWIR1 band (LANDSAT-8 band, downloaded from USGS), you can gain an incredible amount of information.
These images were produced in QGIS and literally took minutes to create. This type of imagery analysis is relatively simple both to create and to compare. I would consider this to be a very basic project in QGIS.
There are certainly more advanced ways to illustrate the ice changes. For example, adding vector layers overtop of the raster images, highlighting the ice concentrations over time (a more scientific approach). There really is no one way to highlight changes like this.
Projects like analyzing polar ice changes is a collective effort for scientific community. It is also very much for anybody else who has an interest in these kinds of topics and has the willingness to discover. Anybody who dives into QGIS could figure out the next best way to do something that benefits our world.
Now, why am I saying all of this you ask? I have taken three GIS classes now where I have had to work in QGIS. After this summer class, I will no longer be working in QGIS from an academic standpoint.
But the projects most certainly will not stop there. As mentioned in the beginning, there are an endless amount possibilities with what QGIS will let you do.
I can see myself in the near future using QGIS in the workforce, or maybe even at home for personal projects. I may want to use QGIS to map my property lines, figure out where to put my next backyard home improvement project, or figure out the best time to leave for work based on traffic data.
Ok, so some of these things you can just Google right? Well, you could, but you may not have all the data that you need for some of those things. For example, if you wanted sketch out a backyard project, you could draw vector lines to overlay some aerial imagery. This could allow you to map out how you want your back yard to look. This is an example of hyperlocal cartography but my point is that using QGIS to do these things can ultimately provide you with the most information to make the best decision.
Some of these things may sound hard to do all by yourself right? Well, some of these projects are difficult to do, but some of these are not. Odds are an idea that you may have has probably been done by someone else already. I have found that Googling and Youtubing some of your questions is extremely beneficial, and a lot of times you can find a how-to video.
If you made it all the way to the end, thank you and I hope you have learned something. Just Remember, if you put in the effort, you can absolutely make meaningful projects in QGIS for school, work, or for yourself that benefit the world around us.
About the author
Kent Campbell is a geological engineering graduate student at the University of Missouri, Science and Technology at Rolla, MO. He is also an Army Engineer Captain currently serving in the Military. His interests are in terrain analysis and hopes to use some of his QGIS knowledge in his current workforce.