
Want to create a satellite time-lapse for any location around the globe to see how the Earth has changed? You’ve come to the right place. I present to you… An interactive web app for creating a satellite time-lapse without coding!
What is a time-lapse?
A time-lapse of satellite imagery refers to a series of satellite images taken at regular intervals over a specific time period for the same place, typically over the span of days, weeks, or months.
The resulting animation of satellite photos lets people see visual changes in a section of the Earth over time. This is useful for comparing such geographic events as flooding, a wildfire, an earthquake, the rapid development of an area from rural to urban, and melting glaciers.
Using Google Earth Engine to create a time-lapse from satellite imagery
In this post, you’ll learn how to create a short satellite time-lapse movie for any location and to deploy a Google Earth Engine app to Streamlit Cloud:
How to create a satellite time-lapse without coding:
- Draw a Region of Interest (ROI) on the map
- Upload a GeoJSON file to the web app
- Select a satellite image collection
- Select a band combination
- Select an administrative boundary
- Customize time-lapse parameters
- Access your time-lapse in GIF and MP4 formats
How to deploy an Earth Engine app to Streamlit Cloud:
- Fork the streamlit-geospatial repo
- Sign up for an Earth Engine account
- Install GeoPandas, geemap, and Streamlit
- Get an Earth Engine token
- Deploy your app to Streamlit Cloud
Want to jump right in? Here’s the web app and repo code.
Let’s get started!
How to create a satellite time-lapse without coding
1. Draw a Region of Interest (ROI) on the map
First, navigate to Streamlit for Geospatial Applications. Once the app opens in the web browser, click “Create Timelapse” on the left sidebar menu.
You should see a map on the left and a list of options on the right. Pan and zoom the map to find your Region of Interest (ROI).
Next, click the rectangle tool to draw a rectangle on the map:

Due to the limitation of the folium Python package, there is no way to retrieve the coordinates of drawn shapes on the map. So you’ll need to export the ROI manually and upload it back to the web app for subsequent steps.
Click the “Export” button in the upper-right corner of the map to export the ROI as a GeoJSON file to your computer. The GeoJSON file is a plain text file containing the coordinates of the geometries drawn on the map. Use any Text Editor to open and inspect the file.
2. Upload a GeoJSON file to the web app
Click “Browser files” to locate the GeoJSON file exported in the previous step and upload it to the web app. Or you can use other existing GeoJSON. Once you click the “Open” button on the open file dialog, the selected GeoJSON file should be uploaded to the app momentarily with the file name listed under “Browsers files”:

3. Select a satellite image collection
Select “Landsat TM-ETM-OLI” from the dropdown list:

I chose the Landsat program because it’s the longest-running enterprise for acquiring satellite imagery of the Earth since 1972. The most recent satellite, Landsat 9, was successfully launched on 27 September 2021. The “Landsat TM-ETM-OLI” image collection contains all available Landsat imagery acquired since 1984.
If you want to choose a different image collection from the Earth Engine Data Catalog, select “Any Earth Engine ImageCollection.”
4. Select a band combination
Landsat imagery comes with multi-spectral bands. Here are the common spectral bands produced by Landsat TM, ETM+, and OLI sensors:

To display and visualize an image on a computer screen, decide which three spectral bands you want to use for the Red, Green, and Blue (RGB) channels.
Some of the commonly used band combinations include Natural Color (Red/Green/Blue), Color Infrared (NIR/Red/Green), Short-Wave Infrared (SWIR2/SWIR1/Red), Agriculture (SWIR1/NIR/Blue), and Geology (SWIR2/SWIR1/Blue). Read more about Landsat band combinations.
Select a band combination from the dropdown list. Or just enter the title you want to see on the resulting Landsat time-lapse:

5. Select an administrative boundary
If your time-lapse covers a large region, overlay it with an administrative boundary. Select it from the built-in datasets (e.g., Continents, Countries, US States) or select “User-defined,” then enter a HTTP URL for the GeoJSON file:

6. Customize time-lapse parameters
The “Frames per second” parameter controls the speed of the time-lapse. This tells you how many frames appear in every second of video.
The smaller the number, the slower the time-lapse, and vice versa.
For example, a time-lapse of annual Landsat imagery (1984-2021) has 38 frames. At 5 frames per second, the time-lapse would last 7.6 seconds. By default, the app uses all available imagery to create the composite. You can change the start year, the end year, the start month, and the end month if you want a specific time range.
Since Landsat satellites carry optical sensors, you might see clouds in Landsat imagery (especially in the tropics).
By default, the app applies the fmask algorithm to remove clouds, shadows, and snow. This can create black spots (nodata) in your time-lapse. You can also change the font type, size, and color to customize the animated timestamps.
When finished with all parameters, click “Submit”:

7. Access your time-lapse in GIF and MP4 formats
You can now access your time-lapse as a GIF or MP4 animation in 60 seconds. Right-click the image/video to save it, then share it with your friends, family, or on social media!
Examples of Time-lapse Satellite Imagery
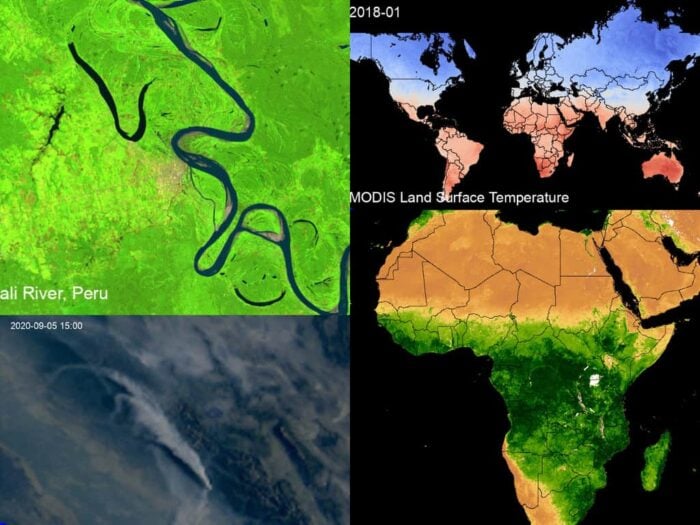
The following video highlights a few time-lapse examples featuring:
- River dynamics of Ucayali River, Peru – Created using Landsat imagery (SWIR1/NIR/Red)
- Vegetation dynamics in Africa – created using monthly MODIS NDVI data
- Northeast Pacific cyclone in October 2021 – Created using GOES-17
- Creek Fire in California in September 2020 – Created using GOES-17
- Temperature dynamics at the global scale – Created using MODIS Land Surface Temperature
Want more examples? Use hashtags #geemap and #streamlit to search on Twitter and LinkedIn.
How to deploy an Earth Engine app to Streamlit Cloud
1. Fork the streamlit-geospatial repo
Fork the streamlit-geospatial repo to your GitHub account. It contains the source code (>1000 lines) of the multi-page web app for various geospatial applications. You can find it here.
2. Sign up for an Earth Engine account
Sign up for a Google Earth Engine account. Once you get the email, log in to the Earth Engine Code Editor to verify that your account has been authorized to use Earth Engine.
3. Install GeoPandas, geemap, and Streamlit
Install GeoPandas, geemap, and Streamlit Python packages. If you have Anaconda or Miniconda installed on your computer, you can create a fresh conda environment to install the required packages using the following commands:
conda create -n gee python=3.8
conda activate gee
conda install geopandas
pip install geemap
4. Get an Earth Engine token
Type python into the terminal and press “Enter” to get into the Python interactive shell. Then type import ee and ee.Authenticate() and press “Enter”:
import ee
ee.Authenticate()

Log in to your Google account to obtain the authorization code and paste it back into the terminal. Once you press “Enter,” an Earth Engine authorization token will be saved to your computer under the following file path (depending on your operating system):
Windows: C:\\Users\\USERNAME\\.config\\earthengine\\credentials
Linux: /home/USERNAME/.config/earthengine/credentials
MacOS: /Users/USERNAME/.config/earthengine/credentials
Navigate to the above file path and open the credentials file using a Text Editor. Copy the token wrapped within the double quotes to the clipboard:

5. Deploy your app to Streamlit Cloud
To deploy your app, click the “New app” button in the upper-right corner of your Streamlit workspace at https://share.streamlit.io, then fill in your repo path (e.g., USERNAME/streamlit-geospatial), branch (e.g., master), and main file path (e.g., app.py). Go to App settings - Secrets and set EARTHENGINE_TOKEN as an environment variable for your web app. Click “Save”:

Depending on the number of dependencies specified in requirements.txt, the app might take a few minutes to install and deploy. Once deployed, you’ll see its URL in your Streamlit Cloud workspace. It’ll follow a standard structure based on your GitHub repo, such as:
<https://share.streamlit.io/>[user name]/[repo name]/[branch name]/[app path]
For example, here is the long app URL: https://share.streamlit.io/giswqs/streamlit-geospatial/app.py. And here is the short app URL: https://streamlit.gishub.org
Wrapping up
Congratulations! 👏 You did it! You have built an interactive web app for creating a satellite time-lapse. You’re welcome to contribute your comments, questions, resources, and apps as issues or pull requeststo the streamlit-geospatial repo.
Want to learn more about GEE and geemap? Check out https://geemap.org , my article, and my YouTube channel for video tutorials. Or get in touch with me on Twitter or LinkedIn.
Thanks for reading, and happy coding!
About the Author
Qiusheng Wu is an Assistant Professor in the Department of Geography at the University of Tennessee, Knoxville. His research interests include Geographic Information Science (GIS), remote sensing, and environmental modeling. More specifically, he is interested in applying geospatial big data, machine learning, and cloud computing (e.g., Google Earth Engine) to study environmental change, especially surface water and wetland inundation dynamics.
Qiusheng Wu is a strong advocate of open science and reproducible research. He has developed and published various open-source packages for advanced geospatial analysis, such as geemap, leafmap, lidar, whitebox-python, whiteboxR, and WhiteboxTools-ArcGIS.