
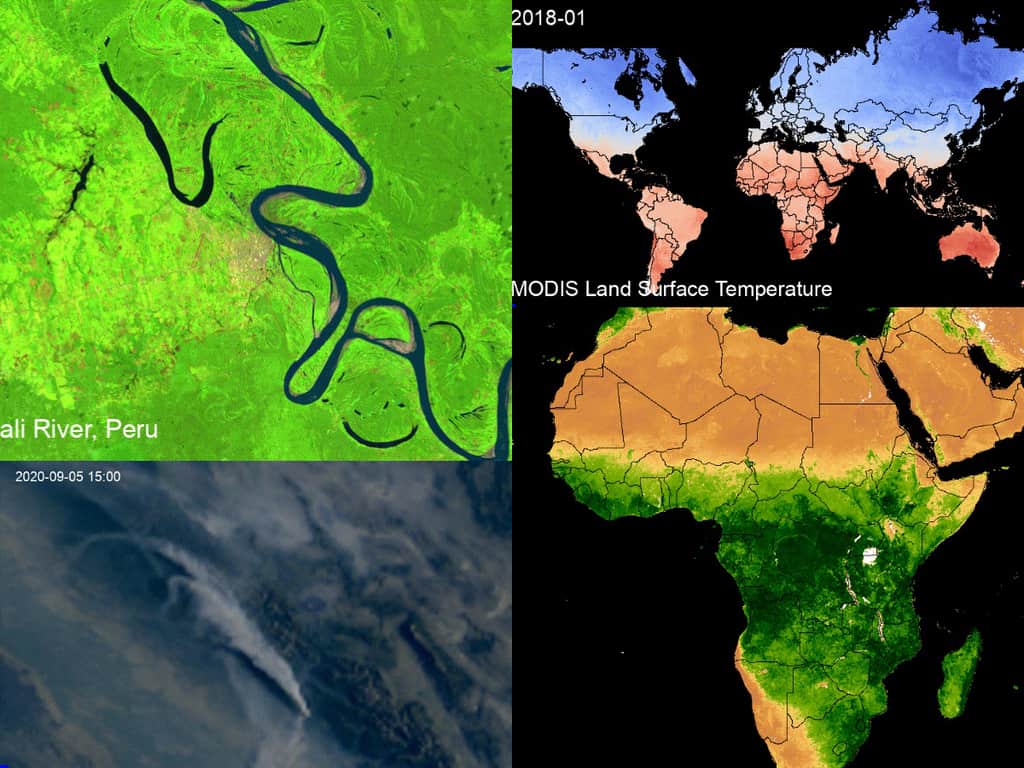
satellite imagery

World’s Biggest Iceberg
The largest iceberg in the world is A-23A, with an area of about 1,240 square miles.

Tracking Penguin Colonies Through Their Droppings
Researchers are using satellite imagery to map Antarctica’s penguin population by estimating their numbers based on the large guano stains left behind.

Relief Inversion
Telling the difference between a canyon and a mountain on aerial or satellite imagery can sometimes be tricky due to an optical illusion known as relief inversion.

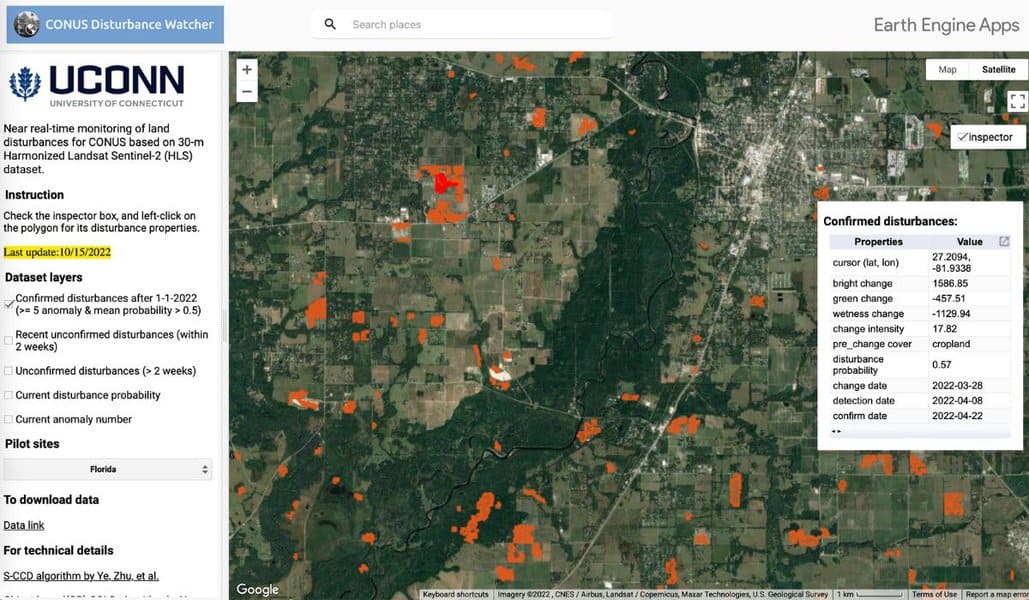
Mapping Long-term Land Use Change with Remote Sensing Data
Discover how remote sensing technology is used to map land use changes, providing valuable insights into environmental impacts and aiding conservation efforts.
Using Geospatial Technologies to Map Hurricane Response
Using satellite data and artificial intelligence, researchers have developed a way to rapidly map hurricane destruction.

Advancements in Mapping Jellyfish: Integrating Remote Sensing and Geospatial Technologies
Mapping swarms of jellyfish has significantly improved due to a combination of remote sensing data, UAV and satellite data, and algorithms that estimate jellyfish migration based on current data.

Remote Sensing for Carbon Offsetting
Remote sensing and geospatial technologies are being harnessed for carbon offsetting efforts.

Landsat: Longest Running Earth Imagery Program
With satellites in orbit since 1972, the Landsat program is the longest running Earth observation program.

Early Wildfires in New Mexico
Wildfires in New Mexico are are starting earlier each year due to warmer and drier conditions.

Landsat 9 Data Released
Landsat 9 satellite imagery and data has been made publicly available.

Open-Source Science in the Cloud Collaboration
NASA and the European Space Agency (ESA) released a new open source and science tool called the Multi-Mission Algorithm and Analysis Platform (MAAP).
How to Create a Time-lapse of Satellite Imagery With Google Earth Engine and Streamlit
Qiusheng Wu explains how to make a 60-second satellite timelapse of any location on the globe.

How the Satellite Imagery Industry is Re-inventing Itself
Joe Morrison discusses how new businesses are developing tools that use satellite imagery and SAR to quantify climate-related disasters.

Mapping Trees in West Africa
Researchers used high resolution satellite imagery and machine learning to map trees in West Africa.

Super-resolution Imaging
Super-resolution is a technique derived from computer vision approaches that tries to increase the quality of an image by employing algorithms and upsampling to improve image sampling.

Deepfake Satellite Imagery
Deepfake satellite imagery is imagery that has been synthetically to alter or change the appearance of an image, often replacing one scene for another.

Views of Earth from Space
Over the decades, Earth has been captured from near and far by astronauts and spacecraft from space.

View From Space: Stuck in the Suez Canal
Satellites have captured imagery of the Ever Given which is currently stuck in the Suez Canal.

Satellite Imagery of the Widest River in the World
The Copernicus Sentinel-1 mission captured this satellite image of the Amazon river that has been processed by the combining of two polarisations into one image.

Satellite Captures Derecho Moving Across the Midwest
The GOES-East satellite captured a derecho over the U.S. Midwest on August 10, 2020.

A View of Hokkaido’s Lattice Windbreaks From Space
The landscape of the Konsen Plateau viewed from above looks like a lattice with crisscrossing lines of narrow strips of forest.

Satellite Imagery Shows Fire Damage to Australia’s Kangaroo Island
Like parts of mainland Australia, Kangaroo Island has been devastated by bushfires fueled by drought and intense temperatures.

View From Space: Australia’s Wildfires
The Moderate Resolution Imaging Spectroradiometer (MODIS) on NASA’s Aqua satellite acquired a natural-color image acquired this image of smoke rising from wildfires burning in New South Wales (NSW) and Queensland.
How Scientists Used Satellite Imagery to Find an Untouched Mountain Rainforest
Dr. Julian Bayliss, a Welsh researcher, used Google Earth satellite images to pinpoint a small rainforest at the summit of Mount Lico.

Satellite Imagery Shows How Much of South Dakota’s Flooded Fields Were Unable to be Farmed
In August of 2019, the U.S. Department of Agriculture reported that South Dakota had 3.9 million “prevented planting” acres.

Mapping the Human Footprint
The world settlement footprint, created in a online application called Urban Thematic Exploration Platform (TEP) sponsored by the European Space Agency (ESA), is the first map that combines optical and radar satellites to create a human urban footprint map of the world.