
satellite imagery

Using Machine Learning and Satellite Imagery to Estimate Corn Crop Production
Descartes Lab, a start-up organization, has created crop production analysis that uses millions of satellite images and machine learning to produce accurate data about the production of agricultural crops.

VANE Query Language: Intuitive Access to Satellite Imagery
Georgy Potapov of OpenWeatherMap introduces the release of the VANE language service, an entirely online service that presents a new concept for accessing satellite imagery. Potapov shares OpenWeatherMap’s vision of how developers can work with satellite and weather data to help the overall geoinformation market to grow.

Geo Quiz: Name the Human Activity Visible from Space
This geography quiz features ten satellite images each showing an anthropogenic activity. Can you figure out what the human activity shown on each image is?

Match Scribbles to Features on the Earth
Land Lines is an experimental online tool that matches drawn gestures on the screen with landforms extracted from satellite imagery.
![Meandering river in Nyingchi, Tibet, China [view in Timelapse] (Image credit: Landsat / Copernicus*). Via: Google](https://www.geographyrealm.com/wp-content/uploads/2020/08/Timelapse-Tibet_China.gif)
Update Google Earth Time Lapse
Google Earth has released a new time-lapse of the Earth, composed of over 5,000,000 satellite images.

First Data Released From ESA Satellite Sentinel 3-A
The European Space Agency and Eumetsat have just released the first data from their new satellite platform, Sentinel 3-A. This groundbreaking new Earth observation platform can monitor a wide range of Earth systems, and will play a vital role in understanding our planet into the future.

Landsat 9 Will Launch in 2020
The Landsat series of satellites has been imaging the Earth’s surface for nearly 50 years, providing vital imagery for a range of purposes from the natural sciences to civil administration and conflict monitoring. NASA and the USGS recently announced that the next iteration of the program, Landsat 9, is due to launch in 2020.
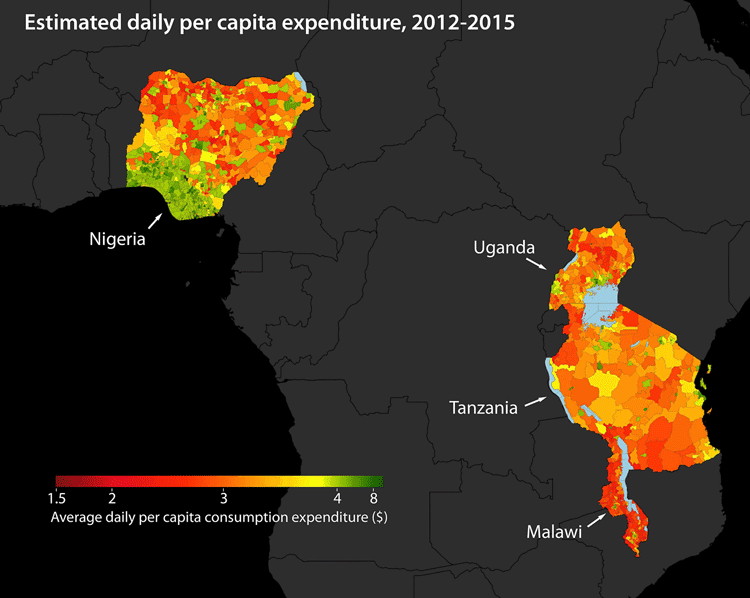
Using Machine Learning to Map Poverty from Satellite Imagery
Satellite images are now being used to map poverty levels around the world using machine learning used to analyze specific poverty data using a convolutional neural network.

Swipe Through Satellite Data to Help Map Vulnerable Populations
MapSwipe and its team of digital volunteers utilize the abundance of smart phone technology to gather more information on natural disasters and the impact they have on people, cities, and countries around the world.

This Interferogram Shows Ground Displacement in Italy as a Result of the Recent Earthquake
The European Space Agency posted an interferogram showing ground displacement as a result of the recent earthquake in Italy.

Using Remote Sensing to Automate the Detection of Landslides
The Sudden Landslide Identification Product (SLIP) developed by NASA detects landslide potential by analyzing satellite imagery for changes in soil moisture, muddiness, and other surface features.

Cloud Computing Used to Analyze Landsat Imagery and Detect Deforestation
Landsat, NASA’s longest running initiative for the acquisition of Earth imagery, has generated nearly 50 trillion pixels of data by capturing one image per season, of every place on Earth, for the past 43 years, providing a treasure trove of data for researchers.
Researchers: Satellite Imagery Could Boost Wildlife Conservation
An increased number of scientists, conservationists and technology scions are banding together to use their various strengths to benefit conservation efforts to track global biodiversity.

Five Applications of Satellite Data
To illustrate the benefits, here are five uses of satellite imagery and data.

Orbital Insight Shows How Artificial Intelligence (AI) Can Be Used to Study Images from Space
Orbital Insights has developed a “deep learning” processes which uses artificial intelligence to pull data from satellite imagery.

Satellite Imagery Provides Insights to Global Questions and Changes the Data Landscape
Data extracted from satellite images have been helpful for tracking everything from the number of customers at retail and restaurant chains to tracking the rates of deforestation.

First Satellite Images from Sentinel-2 Delivered
Four days after its launch, the first images from Sentinel-2 have been delivered. Covering an area from central Europe and the ...

Landsat 8 Data Users Handbook
Launched in 2013 by NASA, Landsat 8 is the latest satellite in the series. The mission of the orbiting satellite is ...

Using Satellite Imagery to Track the Ocean’s Acidity
The Earth’s oceans play a vital role in the health of the planet. ocean dynamics impact weather patterns, it provides ...

How Many Lakes are There in the World?
Using high-resolution satellite images, researchers created the GLObal WAter BOdies database (GLOWABO), which includes all lakes larger than 0.002 km2.

Borders that are Visible on Satellite Imagery
Here are international borders that are visible on satellite imagery.

Rud-e-Gaz and Rud-e-Hara Wetlands, Iran
This satellite image captured of southern Iran shows what an arid and inhospitable area most of this region is.
First Satellite Images from Sentinel-1A
Launched on April 3 and reaching operational altitude on April 11, the first images captured by the European Space Agency’s ...

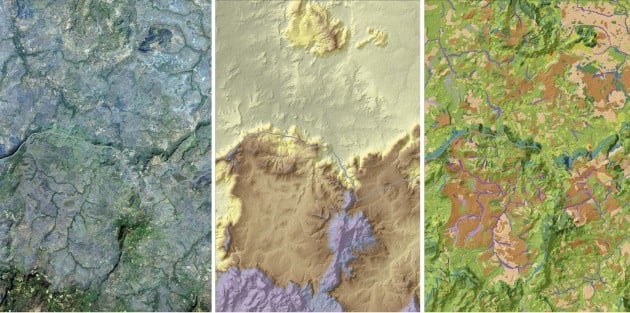
Imagery and Its Use in GIS
Most imagery for use in GIS projects consist of satellite images or aerial photographs but it can also include, thermal images, digital elevation models (DEMs), scanned maps and land classification maps. This article examines imagery and how to effectively gather, store, process and interpret it for a variety of different GIS projects.

Shadows and Angles: Measuring Object Heights from Satellite Imagery
Because of the wonderful metadata that comes with satellite images, shadows can be employed to estimate the height of the objects which cast them.

The Role of High-Resolution Imagery and GIS in Flood Relief Efforts in Colorado
With flooding events in the United States, high-resolution imagery and GIS play a role assessing flood-related damages in order to assign and focus relief efforts.