
By Harley Schinagl
Some readers might be familiar with this GIS Lounge article from late 2020, where pest plant (weed) management was greatly enhanced by using automated GPS tracking technology.
Specifically, this technology is the STA logger, produced by TerraLab from Australia, and it’s bringing data analytics and objective reporting to the conservation, forestry, mining and water industries.
The previous article discussed many of the workflow improvements gained by using the STA logger over conventional GPS in a weed control setting simply by eliminating double handling of field tools, and reducing data management. It goes on to discuss the objective metrics and reporting capabilities of such a tool and the streamline delivery of that data through a browser-based web application, or straight to your desktop GIS as a layer. In essence, you connect it to your spray gear, and the data is in your browser, hands free.
So why are we here again? Well … Trees.

Reforestation
For some time now, STA logger users have enjoyed the flexibility of taking the device off their backpack sprayers, and connecting it to a high-volume sprayer, and vice versa. This flexibility allows users to be able to maximise their use of the devices that they invest in and keep all their data in one place.
Now the loggers can also be fitted to tree planters.

By using the logger on a tree planter such as the Finnish made Pottiputki (shown), the forester can mark the location of the trees as they are planted. This not only records the location of the tree, but the date and time of installation too. Because it is done using the STA logger, the data is automatically uploaded at the end of the day and available in a web layer just like the spray data. No handling needed.
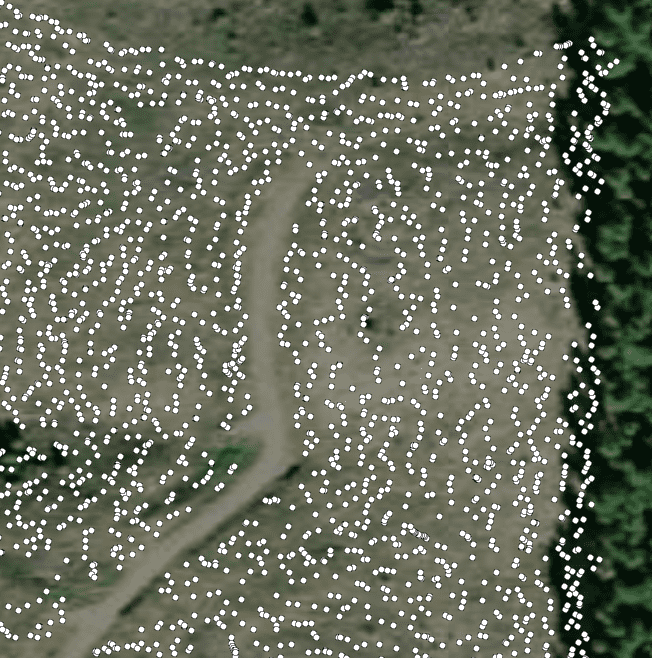
Not only is this useful for forest managers for inventory purposes, but also for contractors to know who planted how many and where. The map viewer can be used to locate gaps requiring infill and can be integrated into mobile GIS solutions to help navigate to those locations of low density.
Once in the system, these points can also be used for future monitoring as each tree has a unique ID which can be utilised throughout its life cycle; This unique ID is also useful to demonstrate in the chain of custody in a forestry setting.
An end-to-end solution
Using the tree planting solution in conjunction with the current spray functionality gives you an even more powerful output. When weeds begin to engulf the planted seedling, weed control at the base of the seedling is required. By using a STA logger during weed control you can get an update on your tree inventory every time you knock-down the weeds near the plant during relief/maintenance spraying.
Imagine the tree planting data showed that there are 1,000 trees per hectare in a planting area. A few months later, a spray crew arrive to perform relief spraying and spray all the weeds around the base of the tree that are threatening to engulf it. The spray crew are also using STA loggers and their data identifies that there are 800 unique spray events per hectare. The forest managers now know that they have suffered a 20% loss, or 200 trees per hectare.
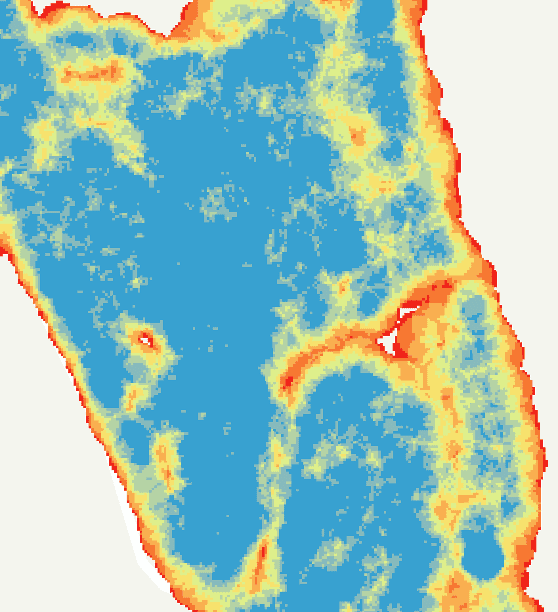
Not only that, but by producing a point density map, they can identify the exact locations of the losses so that a replanting crew can specifically target those areas.
Furthermore, conventional control of noxious weeds in areas surrounding the planting plot will also be made more efficient by the logger. The weed team can sum the estimated footprint of their spray work and use it in their reporting. They can also break it down into target species based on the integrated selector switch and return to those known weed locations in subsequent control runs.
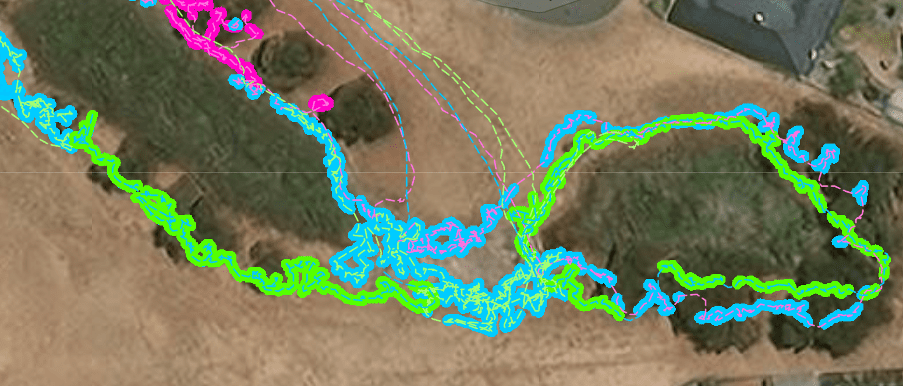
This data not only provides evidence that the work was done, but can be used in compliance to demonstrate the date and times of control, the amount of work completed, and that certain areas such as environmentally sensitive areas where not encroached on.
Why stop there?
Next the weed team put their STA loggers on a pole mount, and use the toggle switch to map their woody weed control work undertaken with chainsaws and hand saws. On the way out of the forest, they find a threatened species and also use the STA logger to mark the location, knowing that the position will be safely uploaded with the rest of their data and able to be passed on to the forest manager. While there are other mapping tools suitable for this handheld situation, the convenience of having the STA logger at hand, and the data streaming into the one layer without the need for processing makes it so much more valuable.
Integrated GIS solutions
Many STA logger users simply refer to the web application for a quick view of their data. Its web map style is convenient and familiar to most. However, the data is stored in a hosted feature service, meaning it is easily consumable by modern GIS software able to load layers from the web. This means that you can have the live layer pre-loaded in your organisations map template so that every time you open your GIS, the updated STA logger data is ready for visualisation, export and analysis.
If you need to produce custom metrics from the data to match your reporting commitments, you can support this on the desktop with a geoprocessing workflow, creating a geoprocessing model or python scripts that slice and dice things to your needs.
The web-GIS capabilities can be extended even further by incorporating the layers into your organisations mobile GIS, into your own web applications, or into live reporting dashboards. The latter is particularly powerful when it is important to get up to date metrics on your planting and spray campaigns.

At the enterprise level, STA logger data can be registered and synchronised so that an organisation can disseminate the data in a format consistent with their policies.
Those at the front line of conservation and reforestation have a monumental task ahead of them. Requiring them to use additional devices, connect to Bluetooth devices, setup digital projects and handle data as well as be a weed identification and control specialist is setting your team up for errors. The STA logger makes data collection and visualisation automatic and now provides an end-to-end solution for reforestation.