
Dackery Geiman outlines the challenges he encountered finding geospatial data about caves and using QGIS to map cave density in Missouri.
My experience with QGIS over the past four month has been a good one as it’s become easy from me to use as I learned through my master’s degree program and through trial and error to understand the functions of QGIS and how it displays data.
As part of my master’s degree in geological engineering, I learnt a lot about raster and vector data and how to use it in the QGIS program to show data and visuals on images and maps.
One of my final projects for my degree was to pick a topic of our choosing and build a QGIS Project and present the data and our findings.
Finding GIS cave data
For my project, I wanted to show the correlations of cave systems and missing people in and around National Forests. It is quite difficult to find exact locations of caves in the United States. Any data on caves seemed lackluster with very few locations.
I finally found an article on the United States Geological Survey (USGS) website stating that information on entries for caves in the Geographic Names Information System (GNIS) cannot be retrieved due to the 1988 National Cave Management Resources Act, Department of the Interior Regulation 43 (CFR Subtitle A, Part 37) forbids the release of information regarding the location of all caves on Federal Lands.
Geological features classified as “caves” cannot be found on GNIS database because the system is unable to distinguish between caves on Federal Lands and caves on public lands. If I wanted information regarding the location of caves in GNIS, you must send a written request to the office of the Secretary of the Interior.
My request would be analyzed on a case-by-case basis before I would be allowed the information I desired. Unfortunately, I did not have enough time to wait for a response back from the Secretary of the Interior in order to complete my project on time.
I started to scour different online GIS databases such as USGS Earth Explorer, Esri Open Data Hub, Natural Earth Data, to name a few. I eventually found cave density data of Missouri on the Missouri Spatial Data Information Service.
Missouri is known as the Cave State, and I found plenty of data on caves and other geological features on Missouri during my research for cave data. I was unable to find the exact locations of the caves, but I at least had the cave density on 1:24,000 Quadrant maps.
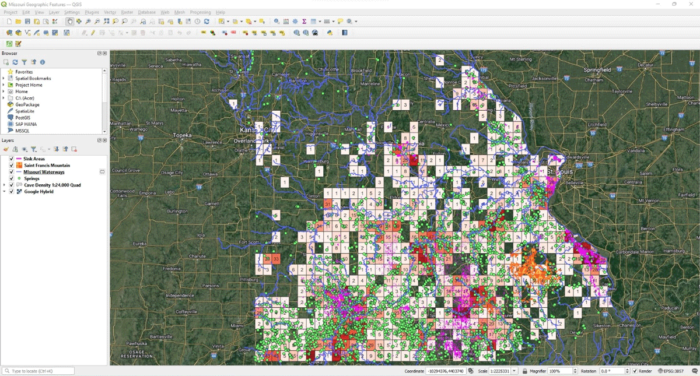
With all the data I found on Missouri, I decided to change my project a little. Instead of comparing cave locations to missing people, I decided to show the correlation of cave location and density with glacial maximum, spring, sink area, volcanic, glacial melting and river data of the geological strata of Missouri.
After changing the direction of my GIS project, all the data seemed to fall into place. I was able to find the data files I needed to import into QGIS in order to relate the information in one place. I accessed files from Saint Francis Mountain volcanic data from USGS, spring and sink data from State of Missouri Data Portal and the cave density data from Missouri Spatial Data Information Service.
Using QGIS to Map Cave Location and Density
Once I started the QGIS program, I added a plug-in called QuickMapServices, this allowed to select from a wide range of maps I could use in my project. I selected Google Hybrid with the thought that it would be familiar to just about everyone who has used Google Maps to find their way from location to location.
I began adding my vector layers to my project by going to the Layer tab, the Add Vector Layer and browse for the zip files I accessed from the various databases. I struggled a little bit at first manipulating the datafiles, but once I figured out what data I wanted to display, I was able to complete my project with multiple layers and was able to compare different datasets and correlate the different geological features and how they formed over the geologic timescale.

Overall, my experience with QGIS was a good one. Finding the data, I needed was not as easy as I thought it would be, even on public databases. I found that I needed to be more specific with the data that I was looking and try looking at different databases because data that is collected is not always submitted or shared in every database.
I also learned that some databases ask that you request permissions to help regulate and for quality control in order to help prevent false data.
QGIS took me a little while to figure out what I was doing even after having a crash course on the program. I think it was best that I learned by playing around with the program and learn through trial and error. It took some time, but in the end, I ended up with a product that I could call my own and produce a product that I can add to the GIS community for others to see and learn from or give criticism on how I can make my product better.
I would encourage anyone interested in GIS and mapping to try learning how to use QGIS; its free and easy to use once you understand how the program operates.
References
Missouri Spatial Data Information Service, 2018. MO 2018 Sink Areas. URL https://data-msdis.opendata.arcgis.com/
Missouri Speleological Society (MSS), 2019. MO 2019 Cave Density 24 000 Quad. URL https://www.mospeleo.org/
QGIS Development Team, 2009. QGIS Geographic Information System. Open Source Geospatial Foundation. URL http://qgis.org
State of Missouri Data Portal, 2016. Springs. URL https://data.mo.gov/
United States Geographic Survey. St. Francois mountains volcanic supergroup. URL https://www.usgs.gov/