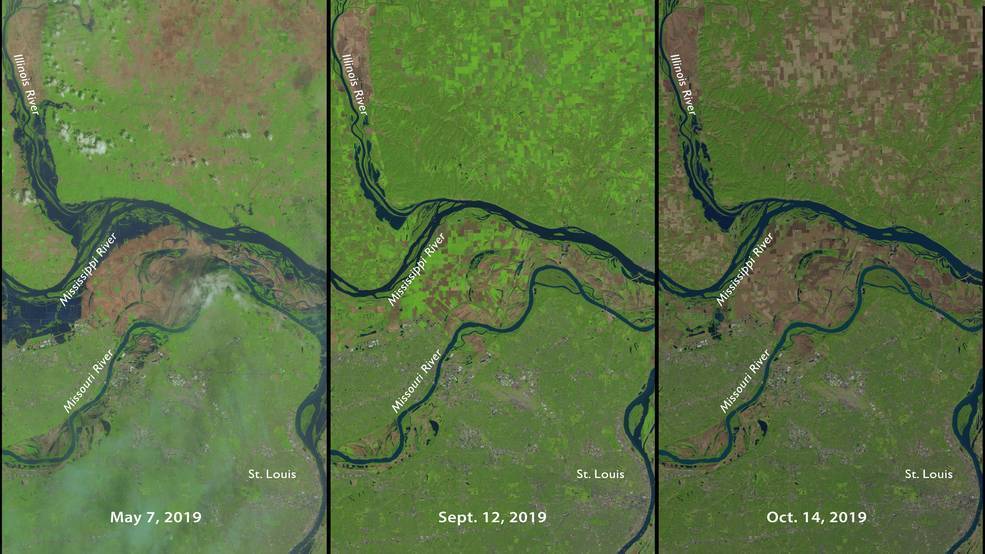
The Cropland Data Layer (CDL) produced by the United States Department of Agriculture (USDA) is a GIS dataset that maps out crop output across the conterminous US. Each year the USDA tracks the acreage and annual yield of every crop grown in those 48 states.
From small crops to large crops such as corn and soy, over 100 different types of crops are mapped. To develop these annual datasets, the USDA relies in part on ground observations and survey data to monitor crops such as corn, wheat, soy, and cotton in the lower 48 states.
In 2009, the USDA began to supplement group surveys and farmer reports with remote sensing. Landsat imagery has helped the organization to fill in missing gaps in the data.
Landsat imagery allows the USDA to see which fields are flooded and which fields are growing crops.
NASA’s Moderate Resolution Imaging Spectroradiometer (MODIS) instruments aboard the Aqua and Terra satellites collect data that is used to monitor daily vegetation health and growth stage.

CropScape: Mapping Interface for US Crop Production
The resulting data layers can be visualized and downloaded via the USDA’s CropScape interface.

Using Remote Sensing to Update Historical Crop Datasets
A recently published study in the journal Scientific Data, analyzed twenty years of Landsat data to look at corn and soybean crops across the US Midwest from 1998-2018.
While the use of remote sensing to infill data for crop production in the US has been in place for decades, Landsat was not free prior to 2008 and computational power prior to the 2010s was limited.
In the study, the researchers note that prior to 2007, coverage of crops even in the Corn Belt is spotty: “Going further back in time, however, CDL no longer covers the conterminous US or even the entire Corn Belt: in 2007, CDL mapped 21 states; in 2004, 11 states; in 2001, 8 states, and in 1999, 4 states.”
With Landsat now freely available and platforms like Google Earth Engine offer high-powered computing services, the researchers looked at using current CDL data to train a model in infill missing gaps in CDL coverage between 1999 and 2007.
Sherrie Wang, the lead author on the paper explains that the researchers “used Google Earth Engine to apply random forests, a type of machine learning algorithm, to twenty years of Landsat imagery to distinguish corn, soybean, and a combined category of all other crops.”
The resulting data from the study is a nearly twenty-year GIS record of corn and soy maps covering the Midwestern states of Iowa, Indiana, Nebraska, Minnesota, South Dakota, Kansas, Wisconsin, Missouri, Ohio, Michigan, and Kentucky. These 13 states account for approximately 90% of global corn and soybean production.
The researchers hope that the updated crop data layer “will allow researchers to study longer time series of agriculture in the Midwest and assess the effect of policies implemented before 2008.”

Downloading the Corn-Soy Data Layer
The Corn-Soy Data Layer is being hosted on Google Earth Engine. The GIS raster datasets by year (1999 – 2018) is available in TIFF format and can be freely downloaded from Zenodo.
References
The study
Wang, S., Di Tommaso, S., Deines, J. M., & Lobell, D. B. (2020). Mapping twenty years of corn and soybean across the US Midwest using the Landsat archive. Scientific Data, 7(1), 307. https://doi.org/10.1038/s41597-020-00646-4
Wang, Sherrie, Di Tommaso, Stefania, Deines, Jillian, & Lobell, David. (2020). Corn-Soy Data Layer [Data set]. Zenodo. http://doi.org/10.5281/zenodo.3742743
Additional Resources
Gran, R. (2019, November 27). Satellites track status of nation’s food supply. NASA. https://www.nasa.gov/feature/goddard/2019/landsat-data-maps-nation
Mitkish, M., & Wang, S. (2020, September 21). Twenty years of historical US midwestern corn and soybean information is mapped using satellite data archives. Harvest. https://nasaharvest.org/news/twenty-years-historical-us-midwestern-corn-and-soybean-information-mapped-using-satellite-data
