With a plethora of satellite-based remote sensing data available, Google has created an infrastructure, called Google Earth Engine (or Earth Engine), that allows scientists and researchers to access vast amount of data and apply different processing procedures to that data so they can obtain the images they need.
This addresses a major problem for scientists, which is how to best access the increasing amounts of satellite data and enabling an easy place for researchers to start in searching for relevant data.
The service utilises cloud computing to enable different formats of data to be accessed, shared, and integrated. This has entailed creating not only an infrastructure with petabyte-scale capability, but also APIs, using JavaScript and Python, that enable the addition and manipulation of various data such as night-time display of urban lights to imagery.[1]
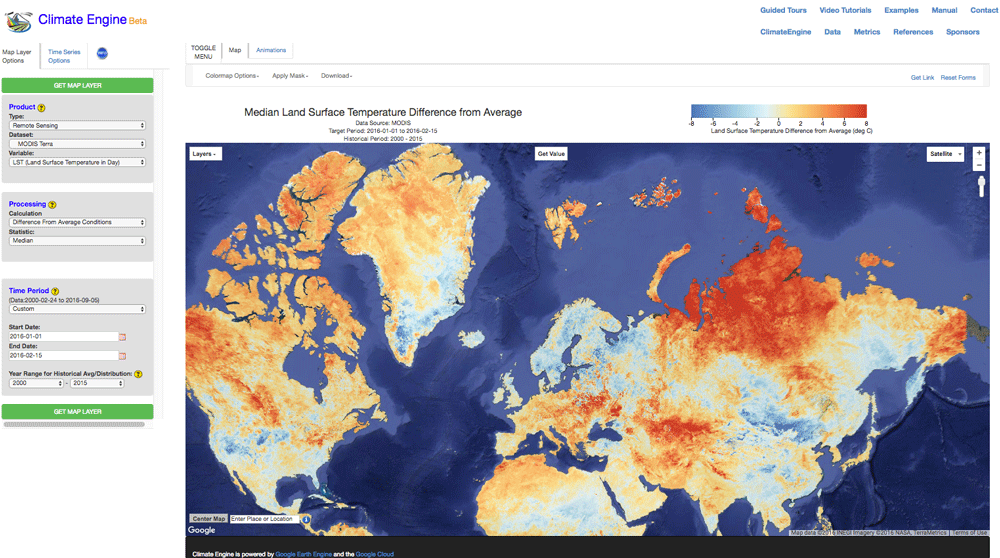
Time-Series Mapping with Climate Engine
What has been very useful for some researchers is the fact the APIs are extensible so that they can be manipulated for more specific types of tasks.
This is the case with Climate Engine, which builds from Google Earth Engine to create an interface that can display time-series mapping information added, such as from the Moderate Resolution Imaging Spectroradiometer (MODIS) imagery, with climate data to enable scientists to more easily obtain surface climate-based data relevant for earth observation.
This saves time and enables tasks that were previously the privy of programmers to be applied by scientists directly.[2]

Analysis of Different Temporal and Spatial Scaled with Earth Engine
One powerful application of Earth Engine is in the integration of different datasets at different temporal and spatial scales.
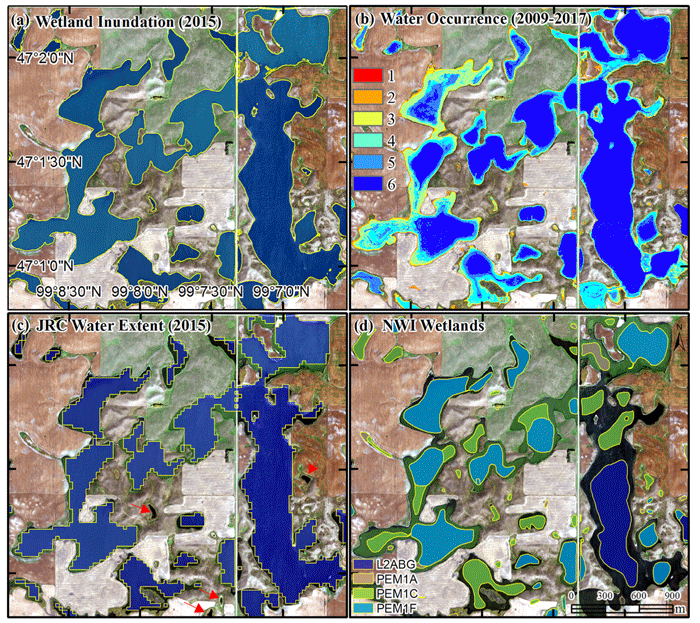
For instance, one research project faced the difficulty of understanding wetland change using lower resolution Landsat data. By integrating Light Detection and Ranging (LiDAR) data along with their aerial imagery, then it became possible using Google Earth Engine to delineate wetland change and inundation extent using also data available on Earth Engine.[3]
Benefits of the Google Earth Engine include the integration of different datasets at different resolution, in this case Sentinel-1, Sentinel-2, and Landsat 8 imagery, over different time intervals such that gaps in data and improvement of identification of features is possible through multi-image integration.
The results helped researchers to apply temporal aggregation of data to fill in major gaps due to cloud coverage that normally would have involved downloading many images and then processing each for integration before then conducting identification analyses that classify land cover features.[4]

Error Detection with Earth Engine
The Earth Engine has encouraged not only new platforms such as Climate Engine, but it has enabled and fostered advances in new algorithms to process and utilize data more efficiently.
One application is detecting errors within data so that they are not propagated in further use in other applications or images as they become integrated. Development of scoring methods, such as using Z-score, Tukey’s outliers, and Geary’s C, to determine where analytical errors are likely or how observations may not relate to what the data are saying can be critical to identify.
Developments in algorithms have included automated error detection that informs researchers on potential issues with using any set of imagery from Google Earth Engine.[5]
Google Earth Engine has enabled thousands of scientists to have access to remote sensing data and to integrate them without having access to sophisticated software or technicians with given skills.
A lot of the data are still at resolutions that might be too low, where data mostly include Landsat imagery. However, this could change as more high resolution data begin to be integrated into the engine.
The time-series nature of the dataset is perhaps the best asset, as it enables a better understanding of our changing world through long-term analysis of data that go back to the 1970s.
Very likely, we will see more applications that are specific to a group of scientific researchers developing from Google Earth Engine, similar to Climate Engine.
References
[1] For more on Google Earth Engine, see: https://developers.google.com/earth-engine/.
[2] For more on Climate Engine, see: http://climateengine.org/.
[3] For more on the effort looking at wetland change and using Google Earth Engine, see: Wu, Q., Lane, C. R., Li, X., Zhao, K., Zhou, Y., Clinton, N., et al. 2019. Integrating LiDAR data and multi-temporal aerial imagery to map wetland inundation dynamics using Google Earth Engine. Remote Sensing of Environment, 228: 1–13. https://doi.org/10.1016/j.rse.2019.04.015
[4] For more on multi-temporal satellite data integration, see: Carrasco, L., O’Neil, A., Morton, R., & Rowland, C. 2019. Evaluating Combinations of Temporally Aggregated Sentinel-1, Sentinel-2 and Landsat 8 for Land Cover Mapping with Google Earth Engine. Remote Sensing, 11(3): 288. https://doi.org/10.3390/rs11030288
[5] For more on error detection algorithms to minimize observation errors using the Google Earth Engine, see: Peter, B. G., & Messina, J. P. 2019. Errors in Time-Series Remote Sensing and an Open Access Application for Detecting and Visualizing Spatial Data Outliers Using Google Earth Engine. IEEE Journal of Selected Topics in Applied Earth Observations and Remote Sensing, 12(4): 1165–1174. https://doi.org/10.1109/JSTARS.2019.2901404
