
The Suitability Modeler in ArcGIS Pro is an effective tool that enables users to carry out suitability analysis by combining various criteria and information. Suitability modeling enables one to assess and rate several sites in accordance with predetermined criteria and limitations to discover the best places for a certain purpose, such as choosing a site for a new facility or locating appropriate habitats for a species.
Although ArcGIS Desktop is used to perform suitability analysis, ArcGIS Pro offers a more modern, powerful, and user-friendly environment for conducting suitability modeling. Its improved performance, advanced geoprocessing tools, collaboration features, and access to the latest features make it a preferable choice for suitability modeling compared to ArcGIS Desktop.
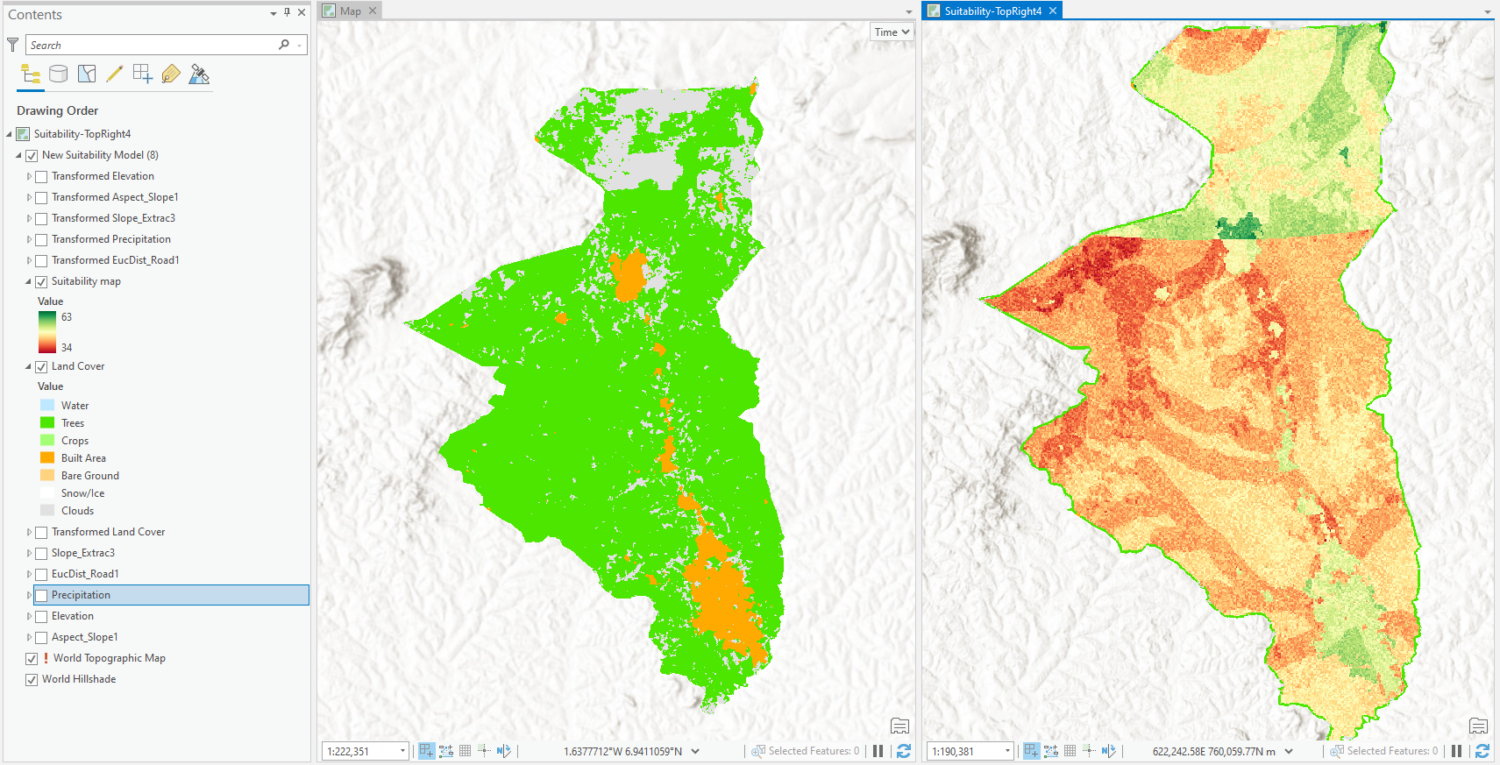
For this tutorial, the suitability modeler is used to determine suitable areas for planting cocoa in Offinso District, Ghana, by using the following datasets (land cover, soil, elevation, slope, aspect, precipitation, and distance to roads). Figure 1 shows a summary of the geospatial tools employed in the tutorial.

Retrieving and importing Soil and Annual Precipitation Data
To retrieve soil data, use the FAO’s website (FAO Map Catalog). Be sure to access the data in a raster format to normalize the data and make it easier for further analysis (weighting and suitability modeling).

To retrieve precipitation data, use the Climatic Research Unit (CRU)’s website (High-resolution gridded datasets (uea.ac.uk)). From their homepage, select “cru_ts4.07.2021.2022.pre.dat.nc.gz” as shown in figure 2 below to download precipitation data between 2021 and 2022.
Although there are precipitation datasets showing different year intervals on the website, the year interval between 2021 and 2022 is used for this tutorial. Watch this Rainfall Data 1901-2021 and Prepare Annual Rainfall Map video for more insight into retrieving and processing precipitation data.

Import soil and rainfall data in to ArcGIS Pro
To import the soil and rainfall data into ArcGIS Pro map canvas:
- Open and create a new project in ArcGIS Pro.
- From the Map tab of the menu bar, select the “Add Data” icon. Navigate to the soil data on your computer to be imported.
- Click OK.
- Repeat the steps above to import the precipitation data.
Convert precipitation data into raster layer in ArcGIS Pro
The default data format for the precipitation data as accessed from the CRU’s website is NetDCF. The geoprocessing toolbox can be used to convert the dataset into layer feature in ArcGIS Pro using the steps below;
- From the search bar of the geoprocessing toolbox, type and search “Make NetCDF Raster Layer.”
- Set “input NetCDF file” to downloaded precipitation data.
- Set “output Raster” Layer to desired output name and location.
- Set “Band Dimension” to time.
- Click Run.

The default coordinate system for the precipitation data is WGS1984. To change the coordinate system to any coordinate system of interest, use the “Project” tool from the geoprocessing toolbox.
Working with Elevation, Slope, and Aspect Data in ArcGIS Pro
Elevation or STRM data can be retrieved from the USGS Earth Explorer’s website after a free sign up or registration process. After the data is retrieved, “Add Data” can be used to import the STRM or Elevation data into the map canvas.
To generate slope data from STRM:
- Type and search slope from the search bar of the geoprocessing toolbox.
- Set “input raster” to STRM or elevation data.
- Set “output raster” to desired output name and location.
- Click Run.
To generate aspect data from slope:
- Type and search aspect from the search of the geoprocessing toolbox.
- Set “input raster” to slope data.
- Set “output raster” to desired output name and location.
- Click Run.
Working with Roads and Land Cover Data in ArcGIS Pro
Roads shapefile can be accessed freely from DIVA-GIS. After retrieving roads data, it can be imported into ArcGIS Pro’s map canvas using “Add Data.” For this tutorial, road is used as a constraint for our suitability model. For easy usage of the data in the model, Euclidean distance tool from the geoprocessing toolbox is used to rasterize the data using the steps outlined below:
- Type and search “Euclidean Distance” from the search bar of the geoprocessing toolbox.
- Set “input Raster or feature source data” to roads data.
- Set “output distance raster” to desired output name and location.
- Set “output direction raster” to desired output name and location.
- Click Run.
To access land cover data with 10m resolution for any area of interest, use Esri’s website. After retrieving land cover data, it can be imported into ArcGIS Pro’s map canvas using “Add Data.
Reclassification and Suitability Modeling in ArcGIS Pro
To perform reclassification and suitability modeling on the imported datasets (roads, land cover, precipitation, elevation, slope, aspect, and soil);

- Click “Suitability Modeler” from the Analysis tab.
- From the settings menu of the suitability modeler panel that appears, set model name to desired name.
- Set “Output suitability Raster” to desired output name and location.
- Set “suitability scale” to 1-5.
- Click “Suitability” from the suitability modeler panel.
- Use the drop down menu to select all the factors to be employed in the suitability modeling process.
- Select land cover from the suitability modeler panel to begin reclassification.

- A transformation, suitability distribution, and reclassification window appears. Suitable edits are made on the suitability field of the reclassification window according to preference. In this case, the suitability model was adjusted to fit cocoa crop planting. As a result, water will be assigned 1 since it is not advisable to plant cocoa in water bodies. Areas covering trees and crops will be assigned 5 since they are very suitable for planting. Use the same analogy to reclassify the classes for the other factors by selecting them from the suitability modeler panel.
- Assign final weights to the factors.
