When it comes to analysing accessibility and travel time, isochrone maps in QGIS are invaluable. These maps use data on travel times and transportation networks to determine how long it takes to travel from one place to another. Several QGIS plugins and tools make isochrone mapping easy. Planners, road engineers, and mapping enthusiasts can gain a better understanding of accessibility patterns in space and make more informed transportation, urban planning, and resource allocation decisions by visualizing travel times.
QGIS tutorial for mapping shortest and fastest routes
A set of start points and destination points were created for this tutorial. The ORS tool in QGIS was used to create isochrones showing 10 and 15 minutes of drive time from the start points. Also, the fastest and shortest routes between the start points, as well as a matrix showing all the possible combinations (time and distance) needed to travel between the start points and destination points, were estimated.
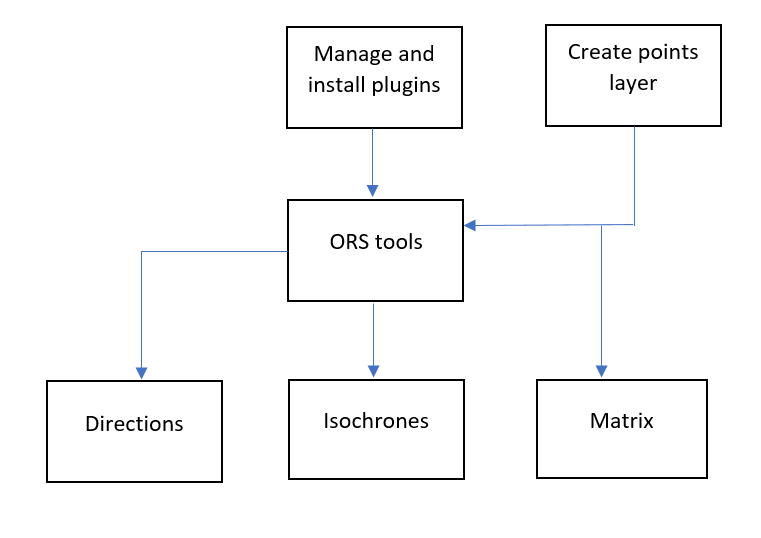
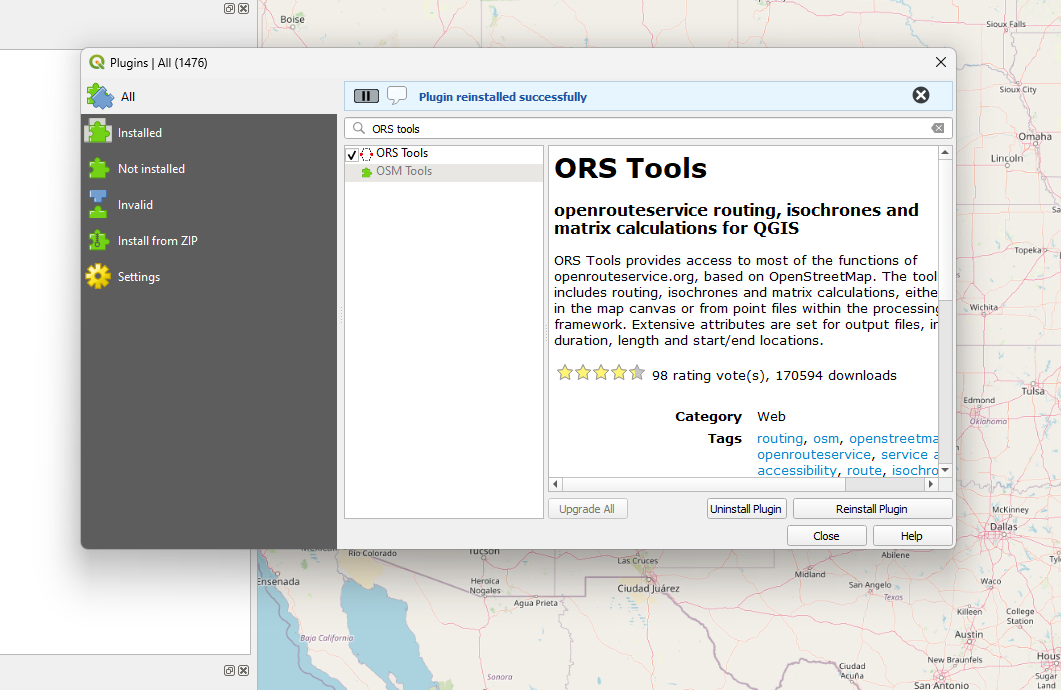
Install Quickmap services and the ORS tools plugin
The Quickmap services plugin helps us to display OpenStreetMap as a base layer for our analysis. To add the OpenStreetMap onto the map canvas:
- Launch and open a new project in QGIS.
- From the menu bar, select Project.
- Select Save as to name and save this project.

- Select Plugins from the menu tab.
- Open “Manage and Install Plugins”, type, and search Quickmap services from the search bar.
- Upgrade the quickmap plugin, where necessary and install.
- From the menu options, select Web.
- Select QuickMap services and choose OSM from the pool of options.
- Select OSM standard to display the openstreet layer onto the map canvas.

The ORS tools plugin is used for determining isochrones around sets of points and determining fastest and shortest routes from start points to destination points. To install the plugin;
- Select Plugins from the menu tab.
- Open “Manage and Install Plugins”, type, and search ORS tools from the search bar.
- Upgrade the plugin, where necessary and install.
Determining the fastest and shortest paths in QGIS
For this tutorial, we will select three start points and save them as a vector layer by digitizing;
- Right-click on any part of the menu bar and select “Browser” from the pool of options that displays to enable the browser panel.
- Toggle to a location where you would like to save the start points.
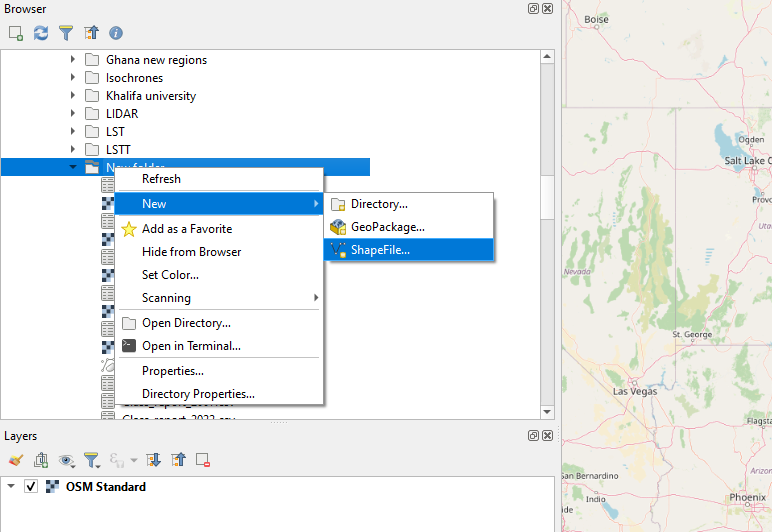
- File name automatically captures the location as specified in the Browser panel.
- Set Geometry type to points.
- Click Ok to create a new point vector layer.
- Drag and drop the “start points” layer from the Browser onto the map canvas.
- Right-click on the “start points” layer and select toggle editing.
- Pan to three points on the OSM layer where you would want the analysis to be conducted.
- From the array of icons, use “Add point feature” tool to select start points.

- Use the save tool on the immediate left of “Add point feature” to save changes.
- Repeat the steps to create a new point layer to represent destination points.
Finding the fastest routes for a set a locations
To determine the fastest routes from our start points:
- Select ORS tools from the web tab on the menu bar.
- Select the Signup option to register. After registration, you will be allowed to create a new token and generate an API key. Copy the API key and paste it into the settings window of the ORS Tools plugin.
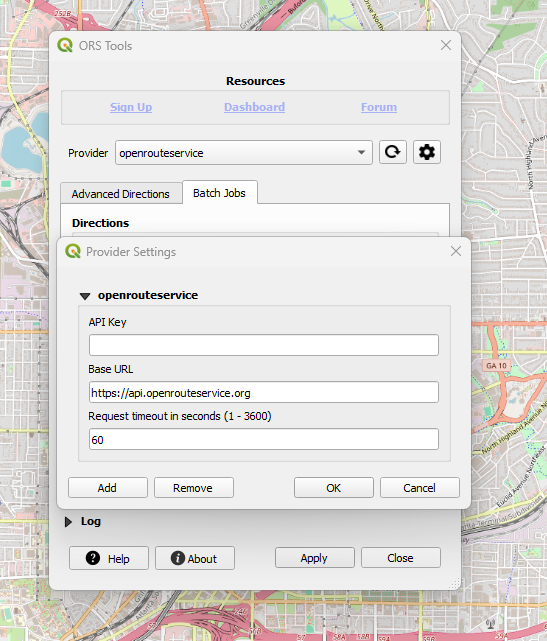
- Select the Batch Jobs tab.
- Select Points (layer 1).
- Set the travel mode to “driving car.”
- Set input point layer to start points.
- Set travel preference to fastest.
- Set Layer ID to ID.
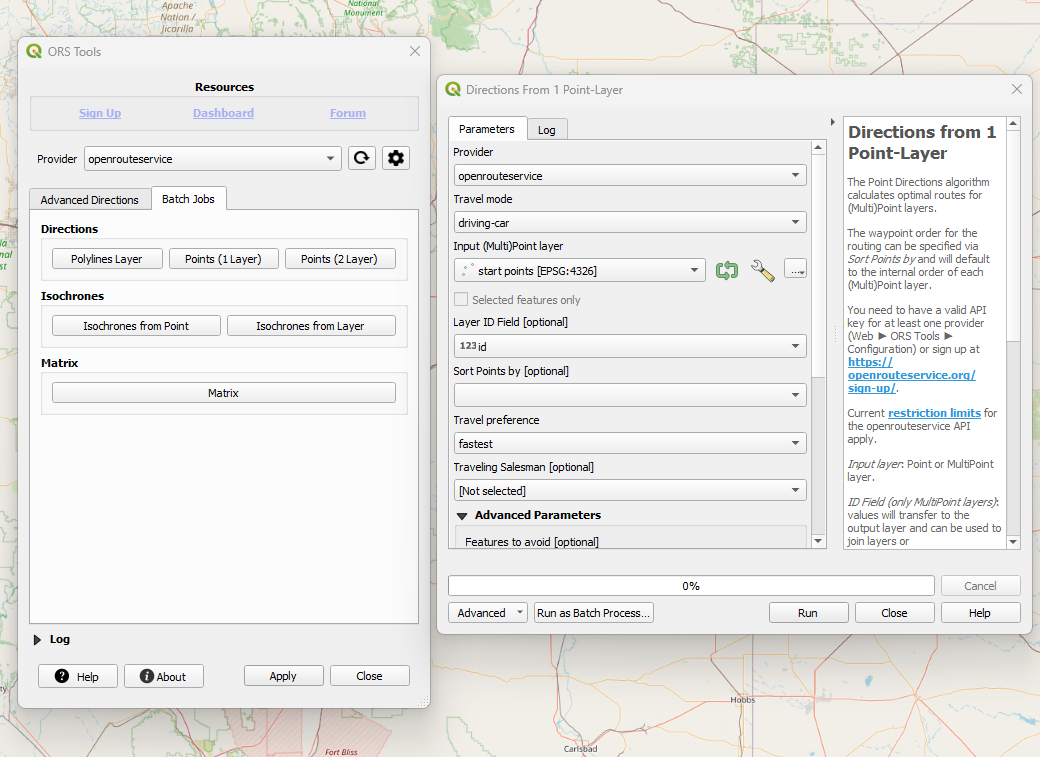
After you have set the parameters:
- Click Run.
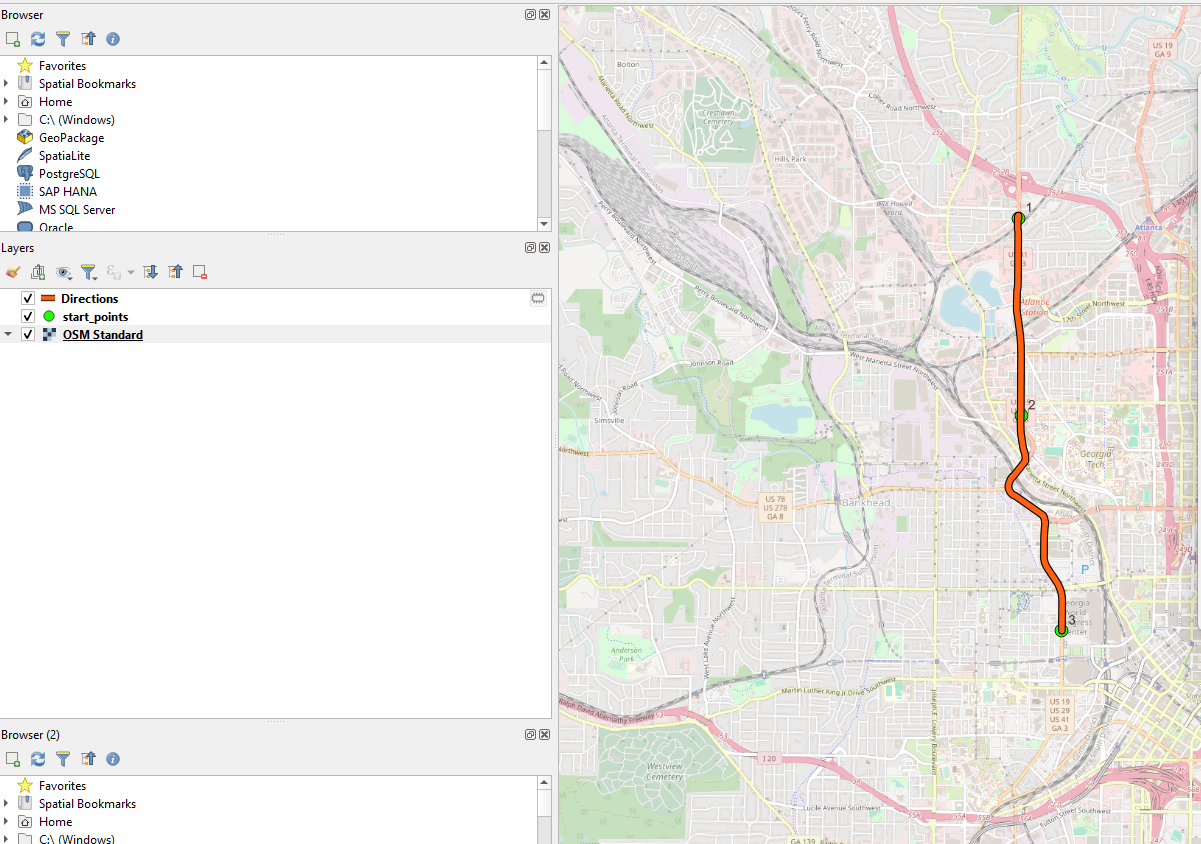
Finding the shortest route for a set of locations
To determine the shortest distance between our start points:
- Select Points (layer 1).
- Set the travel mode to “driving car.”
- Set input point layer to start points.
- Set Layer ID to ID.
- Set travel preference to shortest.
- Click Run.
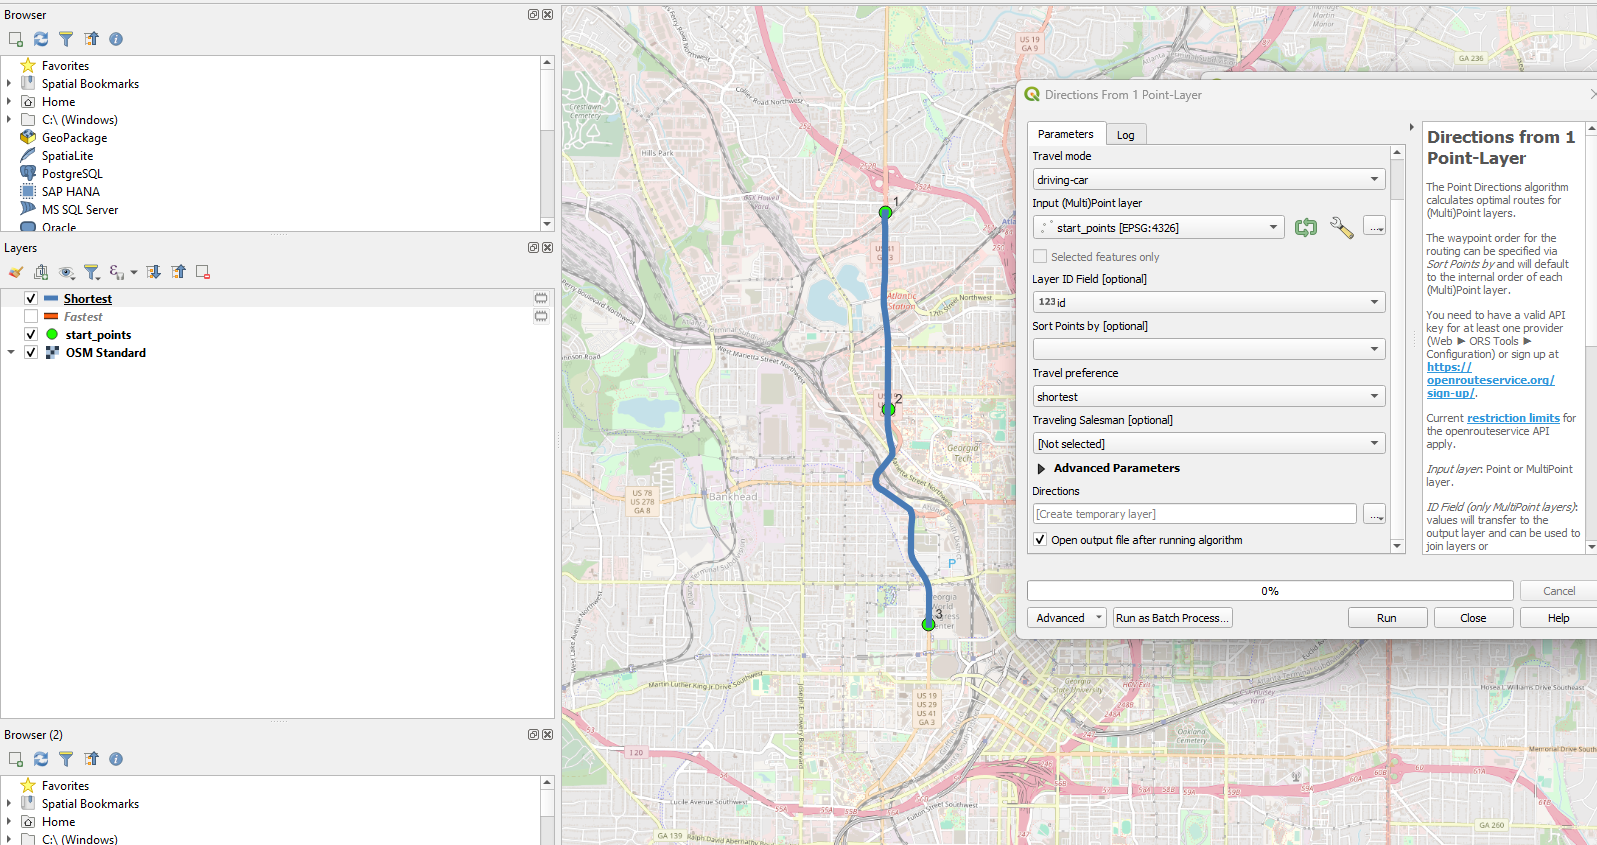
Creating an isochrone map in QGIS
To create isochrones around any point on the map canvas:
- From the isochrones layer, select isochrones from point.
- Set travel mode to driving car.
- Select “input point from map canvas” and specify a point on the map canvas.
- Set dimension to time.
- Set the comma separated ranges to be “5, 10” (min).
- Click Run.
Repeat the steps above to create isochrones of 10, 15 (min) around our start points by selecting “isochrones from layer.”
Determining the matrix of possible combinations of distance-time travel
ORS Tools plugin enables us to generate all possible combinations between our two layers (start points and destination points), showing their distances and time taken. To use the matrix tool:
- Select matrix from the ORS window.
- Set driving mode to driving car.
- Set “input start point layer” to start points.
- Set “Start ID field” to ID.
- Set “input end point layer” to destination points.
- Set “End ID field” to ID.
- Click Run. A table is generated showing the possible distance-time networks from start points to destination points. You can view the contents of the matrix from the attribute table. You can also export the table to excel for viewing.

