
The United States Geological Survey (USGS) recently released updated land cover maps for the conterminous United States that map out how the country’s landscapes have changed over the last 18 years. The United States National Land Cover Database (NLCD) 2019 contains 34 different land cover products that characterize land cover and land cover change over eight epochs from 2001 to 2019.
The eight epochs (calendar years) represented by the NLCD are: 2001, 2004, 2006, 2008, 2011, 2013, 2016, and 2019.
Developed using Landsat imagery, NLCD is a suite of GIS products that classifies the 30-meter resolution imagery into 16 land cover classes. The resulting GIS datasets include land cover changes over the eight epochs as well as urban imperviousness datasets.
More detail about how NLCD is developed is discussed in this earlier GIS Lounge article: Changes to the National Land Cover Database. By correcting previous errors across all land cover classes, the 2019 database improves on the 2016 accuracy, which was the highest ever for NLCD at 91 percent.
More than nine billion pixels make up the land cover dataset. The USGS reports that a comparison of the National Land Cover Databases from 2001 to 2019 reveals that more than 10% of land cover in the Lower 48 states changed during that time period, primarily in forested areas.
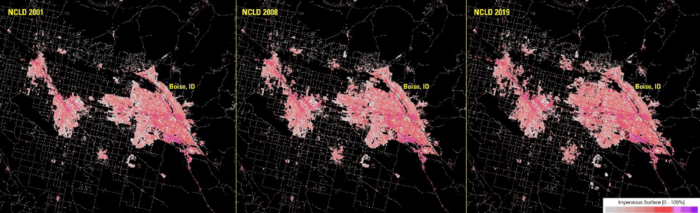
The USGS National Land Cover Database’s suite of GIS mapping products includes a layer that defines the intensity of impervious surfaces across the United States. This information is used in runoff modeling, urban heat, and a variety of other applications.

Mapping Land Cover Change in the U.S. Over Time
Users can visualize land cover changes in the United States by accessing the the Enhanced Visualization and Analysis (EVA) tool. The online mapping tool was developed in by the USGS in partnership with the National Oceanic and Atmospheric Administration (NOAA).
The tool allows users to select any county in the United States and generate a custom report on land cover change, developed areas, cropland change, and other factors.

NLCD Viewer tool
Users can use the NLCD Viewer tool to zoom in on an area of interest, scan for change, access GIS data year by year, or create animations of change over time.

Users can also browse and access all of the NLCD GIS data products.
Reference
New land cover maps capture nearly two decades of change across the U.S. (2021, July 20). USGS.gov. https://www.usgs.gov/news/new-land-cover-maps-capture-nearly-two-decades-change-across-us