
GIS Data
This category contains introductory text about GIS data such as types of error in GIS datasets, types of GIS data (raster and vector), and metadata.

Free Online Geocoder
Online geocoder services will generate latitude and longitude coordinates for a list of addresses.

Mapping Sea-Level Rise with Sentinel-6
The recent launch of Sentinel-6 Michael Freilich/Jason CS is the latest mission that will collect high resolution sea level measurements.

Mapping Carbon Dioxide Emissions from Soil Respiration
Researchers recently developed a map of the global distribution of mean annual soil respiration (Rs) between 2000 and 2014.
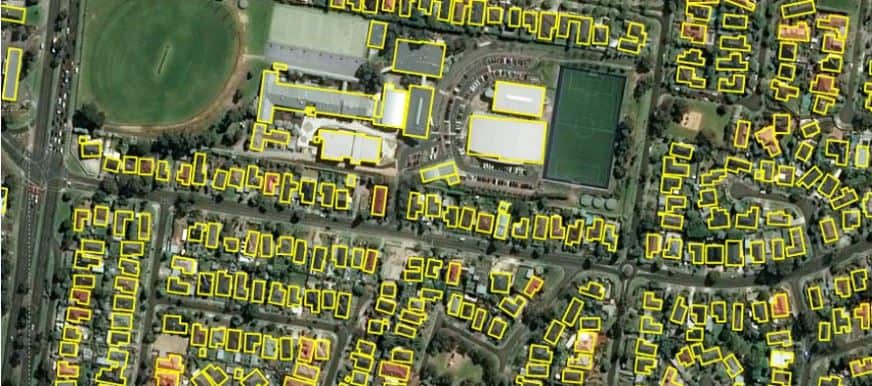
11,334,866 Building Footprints for Australia
Microsoft has released 11,334,866 building footprints covering the country of Australia.

Mapping Crops: Filling in Data Gaps with Landsat Archives
A recent study analyzed twenty years of Landsat data to look at corn and soybean crops across the US Midwest from 1998-2018.

The Important of Mapping Trees for Wildfire Management
The California Forest Observatory, created by Salo Sciences, has applied a new artificial intelligence tool that maps every tree in California.

Using GIS to Monitor the West Coast Wildfires
With fires raging in California, Oregon, and Washington, scientists, activists, geospatial companies, and others are using GIS and spatial data to better inform and protect communities.

Earthquake Detection Using Smartphones
Using aggregated accelerometer data across many smartphones, many of us can now better access a large-scale earthquake warning system.

Using Open Source Geospatial Tools to Find Missing Building Footprints
Researchers have developed a methodology that uses remote sensing measurements to predict completeness in coverage of building footprints in OpenStreetMap data.

Mapping Tropical Forest Quality from Satellite Data
Researchers have created high resolution maps of tropical forest quality using remotely sensed data from NASA satellites.

Find Open Sources of Elevation Data With OpenTopography
OpenTopography is a portal that provides access to open sources of topographical datasets and processing tools.

Open Geospatial Data and COVID-19
Some of the key GIS datasets being used today for research and outreach related to COVID-19 are assessed and reviewed.

Recent Developments in Remote Sensing and Earth Observation
Remote sensing and earth observation capabilities at satellite, aerial, UAV, and ground levels have radically improved in the last decade.

How Geospatial Technologies are Helping to Complete the Effort to Map the World’s Ocean Floor
Only 20% of the ocean's floor has been mapping in detail.

Rivers as Borders: GIS Dataset Available
The Global Subnational River Borders GIS dataset is freely available.

The Earth Archive Project and 3D Mapping the Earth
The Earth Archive Project, launched in 2019, is a project that will provide a detailed 3D map of the entire Earth.

Using Drones to More Accurately Count Sea Turtles
Researchers have found that using drones and underwater cameras is a quicker and more accurate way to count green turtles.

What is Continuous Versus Discrete Data in GIS?
All datasets in GIS can be categorized as being either discrete or continuous.

What is Cadastral GIS Data?
Cadastral GIS data is data that contains information about land ownership. Parcel datasets are one form of cadastral GIS data. ...

Satellite Mapping of Oceans and Coral Reefs
In 2018, NASA launched the ICESat-2 satellite to monitor levels of ice. Researchers have found that this satellite can also measure coral reef systems.

New Satellite Technologies to Monitor Volcanoes and Earthquakes
One relatively new satellite is a small satellite system called the CubeSat Imaging Radar for Earth Sciences (CIRES).

Using Location Data to Map People’s Movements, Social Distancing Efforts, and the Spread of COVID-19
As the COVID-19 pandemic continues, mobility data is being used to track and map out social distancing compliance and track the spread of the coronavirus.
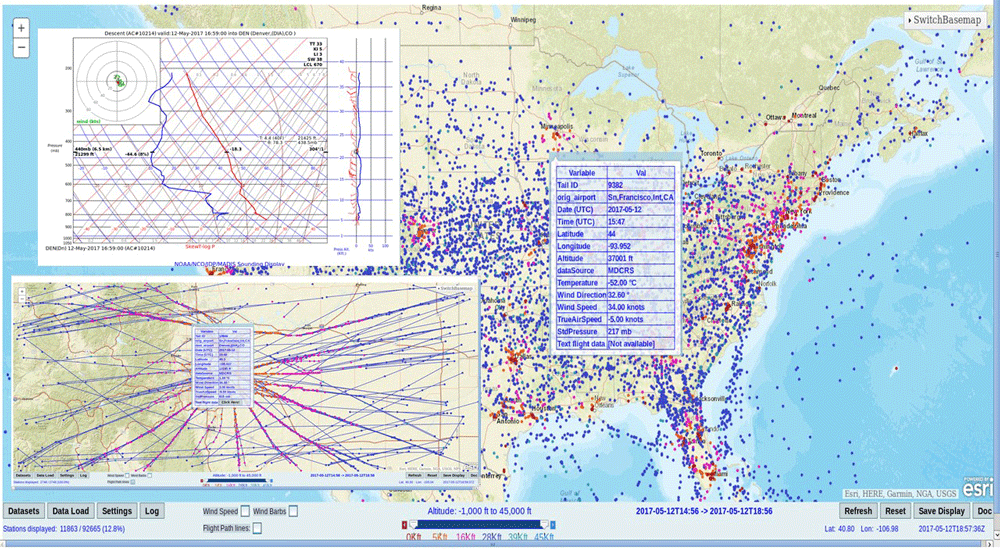
How Weather Forecasting is Affected by Coronavirus-Related Flight Cancellations
Grounded flights due to the coronavirus pandemic is resulting in far fewer aircraft weather observations and less access to repair remote weather stations.

Open Access Novel Coronavirus Data
A newly published article in Nature's Sci Data decribes how epidemiologists collected and curated individual-level novel coronavirus data from a variety of national, local, and news sources.

Access Open GIS Data for Almost 11 Million Trees with OpenTrees
Developed by Steve Bennett, OpenTrees.org lets you visualize and download GIS data for almost 11 million city and park trees around the world.

Updated Global Elevation Data Released by NASA
A new global digital elevation model (DEM) has been released by NASA.