
Scientists have tracked Saharan dust crossing the Atlantic Ocean for decades, but measuring the height of these airborne dust plumes has been much more difficult. Understanding not only where this dust travels but also how high it rises in the atmosphere helps scientists improve weather forecasts and climate models.
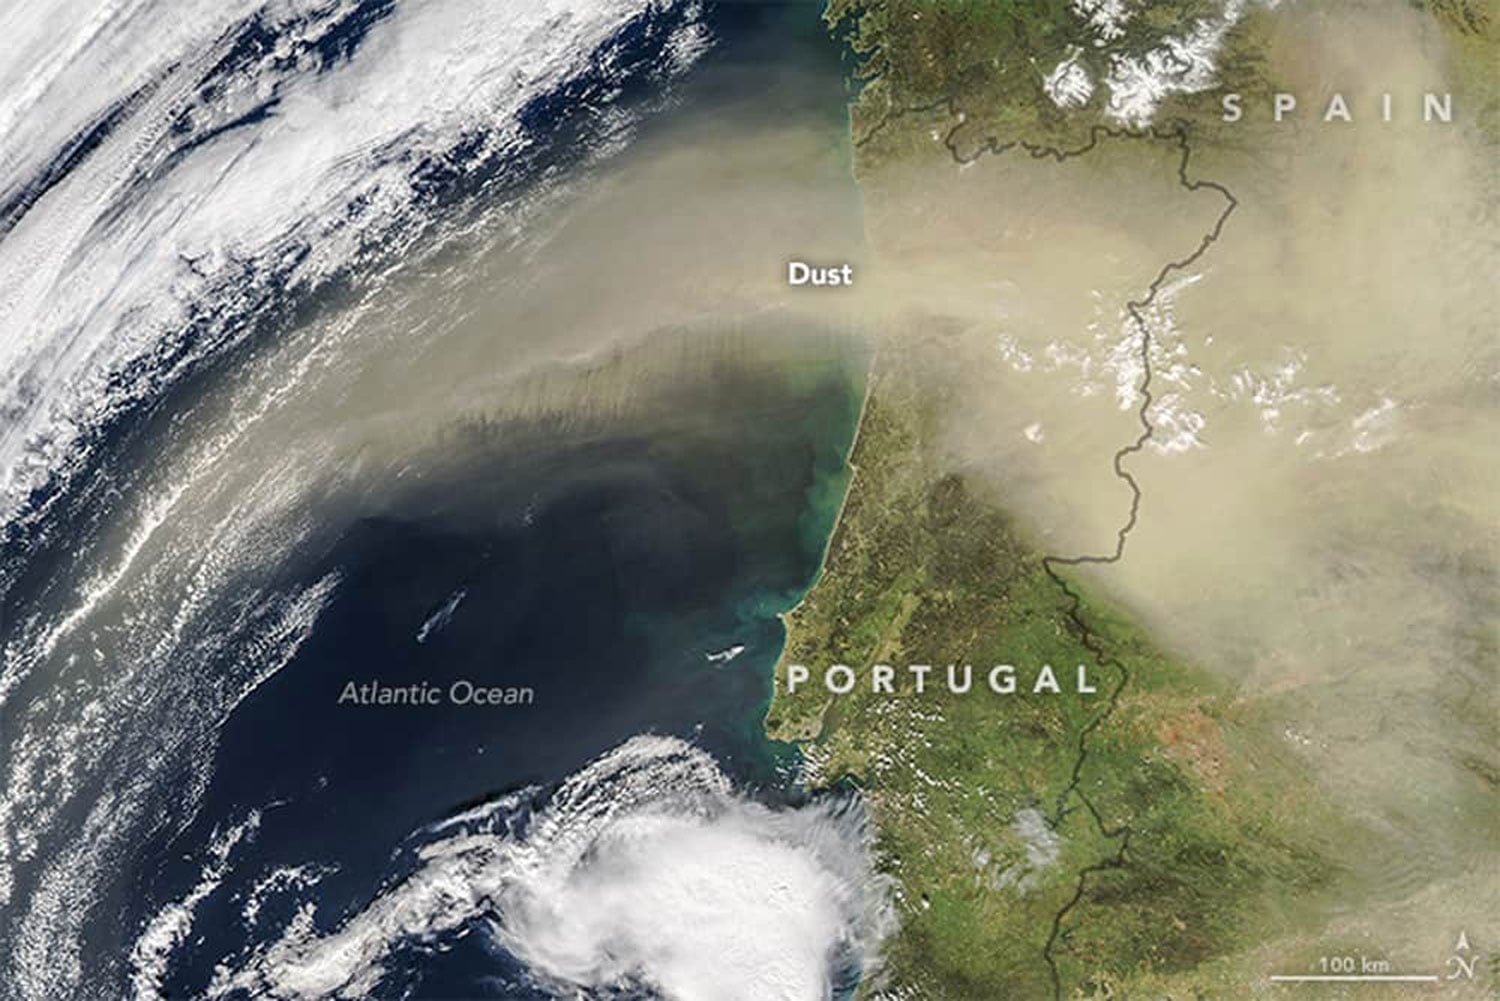
Dust and sand lifted from the Sahara can rise high into Earth’s atmosphere and travel thousands of miles across the Atlantic Ocean, reaching as far as the United States and the Arctic. Saharan dust influences ecosystems, weather patterns, and air quality.
Using deep-space observations to measure Saharan dust height
Understanding how high Saharan dust ascends in the atmosphere is important for assessing its impact on weather forecasting and climate modeling. Dust particles scatter and absorb sunlight, influencing atmospheric temperatures and cloud formation.
The geographic extent of Saharan dust is only part of the picture. The vertical distribution of dust also affects how much of the Sun’s radiation is absorbed or reflected, influencing Earth’s radiative balance.
Limitations of active sensors in measuring atmospheric Saharan dust height
Historical remote sensing and LiDAR based measurements of vertical dust height have their limitations. Active sensors such as the CALIPSO (Cloud-Aerosol Lidar and Infrared Pathfinder Satellite Observation) and the International Space Station-based CATS CATS (Cloud-Aerosol Transport System) have limitations in both geographic coverage and sampling frequency. For example, researchers from NASA noted that CALIPSO was only able to measure 0.2% of the atmosphere in 2023.
Using passive remote sensing to measure atmospheric dust
A study published in Geophysical Research Letters looked at the reliability of using passive remote sensing onboard the deep space satellite DSCOVR (Deep Space Climate Observatory) . Researchers analyzed four years of measurements from the Earth Polychromatic Imaging Camera (EPIC) to calculate the average monthly heights of Saharan dust clouds.
Unlike satellites in low Earth orbit, DSCOVR continuously views the sunlit side of Earth from a fixed position in space, allowing it to observe changes in Saharan dust throughout the day.
Launched in 2015, DSCOVR orbits 1 million miles from Earth at the Lagrange-1 point (L1). The Lagrange-1 (L1) point is a location between Earth and the Sun where their gravitational forces balance. From this position, EPIC observes atmospheric conditions over the Atlantic Ocean every one to two hours.

Researchers from the University of Iowa extracted vertical dust conditions by developing an algorithm that analyzed data collected by EPIC’s oxygen A and B bands. Over a four year period (2015-2019) average vertical atmospheric dust measurements were collected for two separate seasons: the wet season (May–October) and the dry season (November–April). The study found that during the wet season, solar heating creates thermal buoyancy that lifts the dust higher in the atmosphere compared with the dry season.
Using both active and passive sensing to measure atmospheric dust
By contrast, two widely used models (MERRA-2 and NAAPS-RA) do not capture this daily pattern in dust height. These results suggest that EPIC’s multiple measurements each day could help refine atmospheric models so they can better represent how dust moves up and down in the atmosphere over the course of a day.
Combining active and passive remote sensing provides a more complete picture of how Saharan dust moves through the atmosphere, improving weather forecasts and climate models while advancing our understanding of long-range dust transport.
References
Lu, Z., Wang, J., Chen, X., Zeng, J., Wang, Y., Xu, X., … & Xian, P. (2023). First mapping of monthly and diurnal climatology of Saharan dust layer height over the Atlantic Ocean from EPIC/DSCOVR in deep space. Geophysical Research Letters, 50(5), e2022GL102552.
Voiland, A. (2025, February 11). A daily boost in dust height. NASA Earth Observatory.
Xu, X., Wang, J., Wang, Y., Zeng, J., Torres, O., Yang, Y., … & Miller, S. (2017). Passive remote sensing of altitude and optical depth of dust plumes using the oxygen A and B bands: First results from EPIC/DSCOVR at Lagrange‐1 point. Geophysical Research Letters, 44(14), 7544-7554.
