
Virtual reality (VR) has been integrated with GIS for some time, with academic and industry development ongoing since the 1990s. What is different now is data integration and powerful platforms no longer require specialized workstations or high performance computing.
From Esri’s CityEngine to more specialized software such as GeoScope, VR, or what has been called VRGIS, has now moved into area such as utility in Big Data applications, VR within mobile devices, and allowing users to more easily create sophisticated VR visualizations without programming.[1]
Using Virtual Reality and GIS in Urban Planning
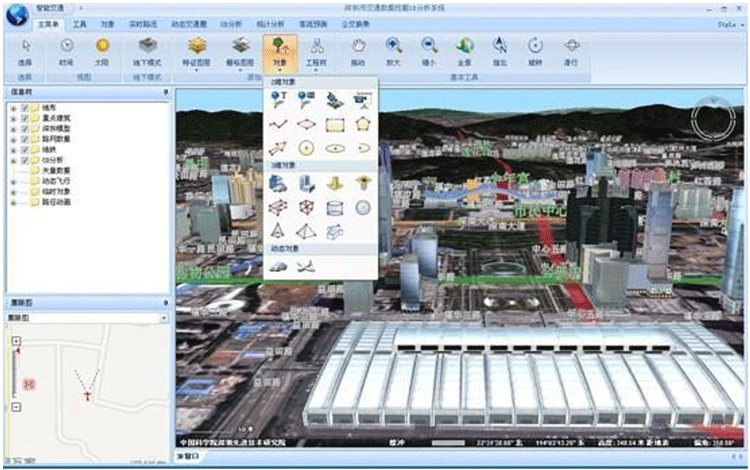
One area of focus is in creating VR applications that provide realistic visualizations of traffic data, where its utility for traffic management is noted.
The integration of real-time data and VR allows traffic management to more easily look at varied layers of transport, while also gaining ability to forecast patterns based on historical or expected patterns. Applying it within web technologies also allows easier sharing of data, where managers and those using transport can readily access needed data.[2]
Applications such as XEarth have incorporated 3D building model data, residents information, real-time and historical traffic data into their platform, allowing for a powerful understanding of city data where everything from current traffic patterns to up-to-date residential information, where the data are applied within a human-computer interaction framework.[3]
Applications with complex data demand have become a major challenge for VRGIS, particularly as these application have incorporated spatial query functions so that desired multi-dimension information can be found more easily, allowing users to better take advantage of analytical capabilities within GIS while still using VR visualization.
Addressing this challenge has included applying multi-task parallel scheduling algorithms that can more quickly process complex data and not just simply look at high volume data. Such approaches allow faster processing of data, allowing for visual and query information to appear more quickly even in more typical desktop environments.
In effect, data has become complex in structure and not just in volume, where VR platforms are particularly well made for visualizing such complex information in their appropriate dimensions.[4]
VRGIS and Teaching
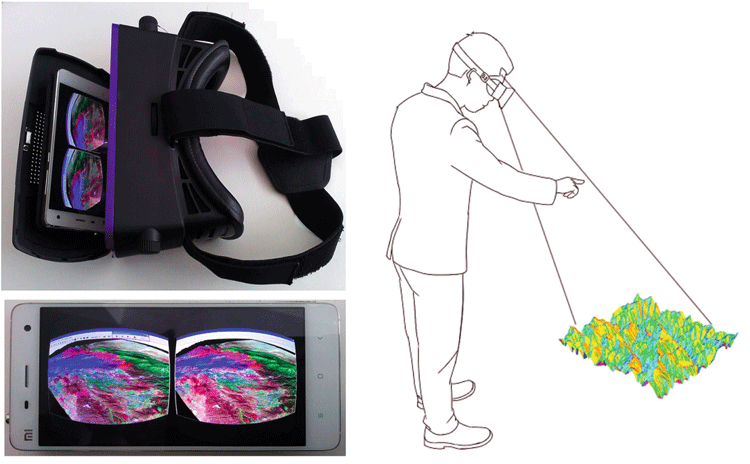
While many VRGIS platforms and applications have focused on urban data, other applications of VRGIS have been in the area of education, including in the teaching of geography, where the integration of HMD glasses allow users to create immersive and interactive experiences while conduction complex spatial analyses. The user, in this case, can apply touch-less interaction to manipulate a given 3D scene.[5]
Other applications of VRGIS have been to understand complex data. In climate modeling, where numerous variables make understanding weather phenomena for given regions an often very complex tax, VRGIS platforms have been considered a way to more easily to visualize complex scientific data in given spatial regions.
In applications, the layering of data in a 3D environment allows users to query and look at other relevant information that may indicate a clearer understanding of factors affecting climate.[6]
While VRGIS has made large strides in the past few years, major challenges remain. First, the integration of VR or even augmented reality with mobile devices continues to be a major focus. The current challenge is to make light and small technologies where VR applications can still be utilized to their full extent while access live and large amounts of data.
While there has been progress in this area, bandwidth and data limitations often mean that mobile devices cannot easily display complex, 3D data visuals as easily as many desktop platforms.[7]
References
GIS Lounge is a participant in the Amazon Services LLC Associates Program, an affiliate advertising program designed to provide a means for sites to earn advertising fees by advertising and linking to amazon.com.
[1] For a general background to VR in GIS, see: Peter F. Fisher & D. Unwin (eds.) (2002) Virtual reality in geography. London ; New York, Taylor & Francis.
[2] For more on using and an example of VRGIS for traffic analysis, see: Li, X., Lv, Z., Wang, W., Zhang, B., et al. (2016) WebVRGIS based traffic analysis and visualization system. Advances in Engineering Software. [Online] 93, 1–8. Available from: doi:10.1016/j.advengsoft.2015.11.003.
[3] For more on XEarth, see: Li, X., Lv, Z., Hu, J., Zhang, B., et al. (2015) XEarth: A 3D GIS platform for managing massive city information. In: [Online]. June 2015 IEEE. pp. 1–6. Available from: doi:10.1109/CIVEMSA.2015.7158625 [Accessed: 21 August 2017].
[4] An example spatial query approach to VRGIS is given in this paper: Wang, W., Lv, Z., Li, X., Xu, W., et al. (2017) Spatial query based virtual reality GIS analysis platform. Neurocomputing. [Online] Available from: doi:10.1016/j.neucom.2016.06.099 [Accessed: 21 August 2017].
[5] The example application of immersive and interactive VRGIS in teaching geography can be read here: Lv, Z. & Li, X. (2016) Virtual Reality Assistant Technology for Learning Primary Geography. In: Zhiguo Gong, Dickson K. W. Chiu, & Di Zou (eds.). Current Developments in Web Based Learning. [Online]. Cham, Springer International Publishing. pp. 31–40.
[6] An discussion of weather and climate data with VR in application with GIS can be found here: Helbig, C., Bauer, H.-S., Rink, K., Wulfmeyer, V., et al. (2014) Concept and workflow for 3D visualization of atmospheric data in a virtual reality environment for analytical approaches. Environmental Earth Sciences. [Online] 72 (10), 3767–3780.
[7] For more on the challenges of VR, see: Mekni, M., and Lemieux, A., 2014, “Augmented reality: Applications, challenges and future trends”, In Proceedings of the 13th International Conference on Applied Computer and Applied Computational Science (ACA-COS ‘14), volume 20 of Recent Advances in Computer Engineering Series, pp. 205-215.