There is an oft repeated yet unsubstantiated claim that 80% of all data has a geographic component. Likewise, some have claimed that Excel is one of the most popular and important pieces of software currently in use. There is a lot of data available in Excel files, many of which have locational attributes stored within the columns. If you have an Excel spreadsheet that columns location data (e.g addresses, ZIP codes, city, country, or coordinates), there is an easy way to map your Excel data using Google Fusion Tables.
This article will take you though a step-by-step example of using an Excel spreadsheet that contains location information to make a map using Google Fusions Table. Prefer to watch a video? Check out 5-Minute Cartography: Make a Map with Google Fusion Tables.
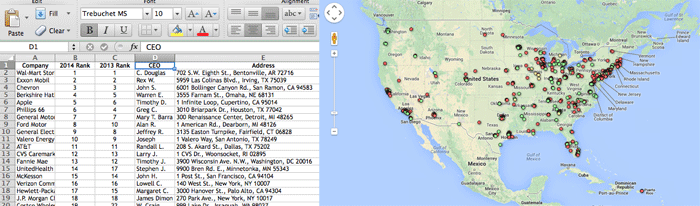
For this example, an Excel file containing the rank of Fortune 1000 companies for 2014 will be used. In the screenshot below, the Excel data contains the Fortune 1000 company name, 2014 rank, 2013, CEO, and location information stored in the columns.

Importing Your Excel File into Google Fusion Tables
While many of Google’s products are free to use, you need to have an account set up first. If you don’t already have an account set up with Google (such as a gmail address), set on up first. You can do this by clicking on the “create account” link found on any of the login pages for Google’s products.
To get started, you first have to set up a Google Fusion Table. To do so, visit drive.google.com and sign in with your Google account. To start a new Google Fusion Table, click on the red create button and then select Fusion Table from the list.

This will bring you to the import table screen where you can upload your Excel file. To do so, click the choose file button and then navigate to the location on your computer where the file is stored. In addition to Excel files, Google also accepts delimited text (such as .txt or .csv) and KML files. Once the file is selected, click on the next button.

The next page allows you to visually verified that the data was imported properly. If the first column has the column names, you can designate this and select none if the columns names are missing. If everything looks okay, select the next button.

The next screen shows the metadata for the table. Here you can add in a name for the table (or accept the default name extracted from the file name). You can also allow the data to be exported by others, add a description, and set the information about attribution of the data.

Once you’ve filled out the form, hit the finish button to import the Excel spreadsheet into your Google Fusion Table. One the import has finished, you will be presented with a view of your imported data. Google automatically attempts to recognize locational information. If it does, the data in the identified column will be highlighted in yellow.

Setting Up Excel Data to Create a Map
In order to map out your Excel data, you have to designate which column(s) contain the location information. Sometimes Google makes this easy by automatically identifying a column that contains location information as in the example above. You can also set columns to be location data manually. To do this, select the column that has the location information you want to map out. If you are using an address, all of the information must be in the same column (see the example above). You can map location information such as a city, by ZIP code, landmark or institution, or by a full address. The only two column location designation allowed is for coordinates (X,Y).
To set a column as a location column, hover your cursor over the column you want to select. An arrow will appear in the right side of the column. Click on the arrow and select change from the menu. From the popup window, find the type option and select location from the menu options. Then hit the save changes button to return to your data. The column should then change to yellow, indicating that it’s now a location column.

Geocoding Excel Data
Now that the appropriate column has been designated at the location data, it’s time to have Google geocode the column so it can be mapped out. To start the geocoding process, click on the map of… tab. The first time you access this time, a window will show up to start the geocoding. The status bar will show you how many of the records have been geocoded and how many of the records are ambiguous (i.e. the location information results in more than one location option). Google Maps Geocoding Service isn’t the speediest, if you have a lot of records, this process can take several minutes. For example, importing the 1,000 records for this tutorial took over ten minutes.

Viewing the Map of Excel Data
Once the geocoding has been completed, a map showing the point location is viewable. As with all Google Maps products, you can pan and zoom the data. The default symbol is the small red dot and you can click on any of the dots to see a popup showing your spreadsheet data for that location.

Customizing the Map
You can change how the data is presented, which information is available in the popup window, and whether to display the data as point locations or as a heat map.
Create a Heat Map in Google Fusion Tables
For example, to display the map above as a heat map, click on the heatmap to open up the options. The point location is transformed to a surface layer with a red to yellow to green gradient. The red areas show areas where the point data is more clustered. You can change the radius to increase the spatial influence of each point data and set how translucent you want the surface layer to be.

Customizing Symbols in Google Fusion Tables
You can also customize how the point data is symbolized. The default is Google’s small red circle. To change the symbols, click on the feature map option and then select change feature styles…. There is a limited set up options to change the symbology shown here. Under the fixed marker icon tab, you can change the color and style for all markers. You can also set up a column to customize the markers. Lastly, if you have quantitative information, you can also organize the markers into buckets.

For example, I color coded the Fortune 1000 company locations based on the 2014 rank.

Adding a Legend to a Google Fusions Map
If you do add multiple color or symbol options for your data, it is helpful to viewers to have a legend attached to the map. To add a legend, click on the change feature styles…. and then select automatic legend. From this window you can set the legend title, legend position, and add a link to the source data.

Customizing the Info Window
You can customize how the data is presented when a user clicks on one of the point locations. To do this, select the Change info window… option. Under the automatic tab, you can choose which columns you’d like to have display. If you want to change how the information is shown, you can use HTML to customize the look and feel of the data in the popup window under the custom tab.

Publishing a Google Fusions Table Map
Once the map is set up and customized, you can opt to share the map with select people or make it publicly available. A publicly available map can then be shared with a link or embedded into a web page.
By default, the table and map is set to private. To change the settings, click on the share button in the upper right hand corner. The pop up shows you a link you can email to people that gives them direct access to your Google Fusions Table. Under who has access, you can change the visibility to yourself only, whoever has access to the link, or public.
Once the privacy settings have been change, you can now publish the map, To publish a map, go to the menu bar and select Tools –> Publish.

Next, a popup window lets you select how you want to share the map. You can either send out a link or use the embed code to serve the map from a web page.

To embed the map, simple set the width and height in pixels you want the map to be and then paste the provided code into a web page. The map is now available to uses to explore:
Watch the Video Tutorial on How to Make a Map with Google Fusion Tables