
The National Insurance Crime Bureau (NICB) each year takes a look at the national picture in terms of car thefts.
Back in 1984 when NICB first started its annual Hot Spot reports, California still led the nation in overall car thefts, with 161,309 that year. New York led the nation in number of thefts per registrations at 1,303.
The peak of car thefts was 1991 with 1.6 million cars stolen that year. The numbers have been dropping thanks to better automobile technology that makes it easier to track stolen vehicles and increased law enforcement resources on car thefts.
For 2013, there were less than 700,000 vehicles stolen, a 58% decline since the peak 22 years ago.
Where are the Most Cars Stolen?
According to the Federal Bureau of Investigation’s (FBI) Uniform Crime Reports for 2012, the West had 37% of all car thefts, followed by the South, with 34.8%, the Midwest, with 18.6%, and the Northeast had 9.7% of thefts.
California is the state with the most stolen cars
Thirty years of reporting later and California still tops the list for most cars stolen. The metropolitan area of Los Angeles-Long Beach earn the top spot for most stolen cars. With 50,758 cars reported stolen, this area accounted for 7.5% of all stolen cars.
The area of San Francisco was second with 29,326 cars stolen, and Chicago-Elgin area rounded out the top three with 24,398 thefts.
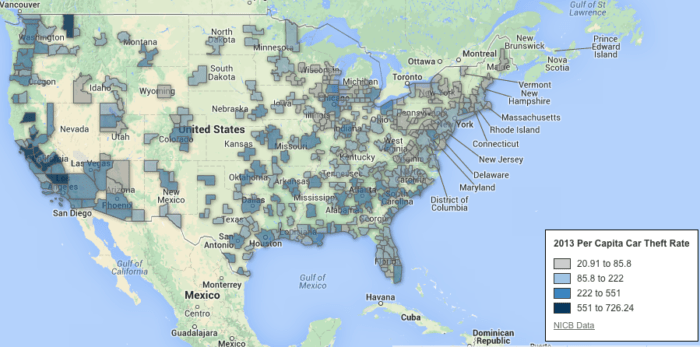
Which Areas have the Highest Rate of Car Theft?
Every year, the NICB releases its list of car thefts, ranked by per capita car thefts for 380 metropolitan areas in the United States.
The top ten areas for car thefts are known as hot spots. Hot spots are areas where the per capita car theft rate ranks as the highest in the nation.
This year’s annual Hot Spot report shows that cities in California hold nine of the ten top locations for car thefts, with the sole exception being the Spokane-Spokane Valley Metropolitan Statistical Area in Washington. The area with the highest rate is Bakersfield where for every 100,000 residents, 725 cars are stolen.
Why Are Car Thefts So High in California?
There are a few factors that experts believe make California such a target for car theft.
Foremost, California is the most populous state in the nation. With a population of 38 million, one out of every eight residents call this state home.
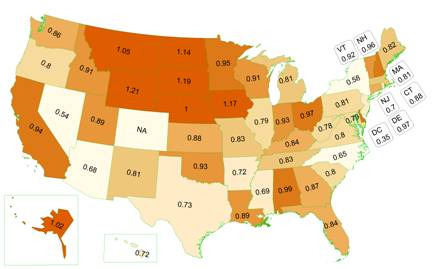
The state is also a land of car owners.
According to the Federal Highway Administration (FHWA), per capita vehicle ownership in California is 0.94. A high rate of car ownership coupled with a heavily populated state means there are a lot of cars in California.
The mild weather in most of California also means that older cars stay in action for longer. Older cars are easier to steal and break down into parts that are resold.
Easy access to the border with Mexico and large ports also create a market for stealing cars for international destinations.
Table of Car Thefts in the United States
Below is the table created by the NICB showing car thefts in the United States for 2013.
| 2013 Rank | MSA | MSA Name | 2013 | 2013 Rate |
|---|---|---|---|---|
| 1 | 12540 | Bakersfield, CA Metropolitan Statistical Area | 6,267 | 725.24 |
| 2 | 23420 | Fresno, CA Metropolitan Statistical Area | 6,750 | 706.61 |
| 3 | 33700 | Modesto, CA Metropolitan Statistical Area | 3,565 | 678.41 |
| 4 | 41860 | San Francisco-Oakland-Hayward, CA Metropolitan Statistical Area | 29,326 | 649.34 |
| 5 | 44700 | Stockton-Lodi, CA Metropolitan Statistical Area | 4,463 | 633.61 |
| 6 | 39820 | Redding, CA Metropolitan Statistical Area | 1,120 | 625.77 |
| 7 | 44060 | Spokane-Spokane Valley, WA Metropolitan Statistical Area | 3,205 | 598.26 |
| 8 | 46700 | Vallejo-Fairfield, CA Metropolitan Statistical Area | 2,540 | 597.95 |
| 9 | 41940 | San Jose-Sunnyvale-Santa Clara, CA Metropolitan Statistical Area | 10,925 | 569.12 |
| 10 | 49700 | Yuba City, CA Metropolitan Statistical Area | 930 | 551.31 |
| 11 | 40140 | Riverside-San Bernardino-Ontario, CA Metropolitan Statistical Area | 22,943 | 523.71 |
| 12 | 36220 | Odessa, TX Metropolitan Statistical Area | 764 | 511.45 |
| 13 | 42660 | Seattle-Tacoma-Bellevue, WA Metropolitan Statistical Area | 18,128 | 502.15 |
| 14 | 32900 | Merced, CA Metropolitan Statistical Area | 1,301 | 494.25 |
| 15 | 47300 | Visalia-Porterville, CA Metropolitan Statistical Area | 2,235 | 492.14 |
| 16 | 41500 | Salinas, CA Metropolitan Statistical Area | 2,109 | 491.81 |
| 17 | 41620 | Salt Lake City, UT Metropolitan Statistical Area | 5,372 | 471.03 |
| 18 | 17020 | Chico, CA Metropolitan Statistical Area | 1,045 | 470.53 |
| 19 | 49420 | Yakima, WA Metropolitan Statistical Area | 1,152 | 466.31 |
| 20 | 10740 | Albuquerque, NM Metropolitan Statistical Area | 4,004 | 443.51 |
| 21 | 24420 | Grants Pass, OR Metropolitan Statistical Area | 368 | 441.74 |
| 22 | 36420 | Oklahoma City, OK Metropolitan Statistical Area | 5,811 | 440.34 |
| 23 | 19820 | Detroit-Warren-Dearborn, MI Metropolitan Statistical Area | 18,343 | 427.08 |
| 24 | 40900 | Sacramento–Roseville–Arden-Arcade, CA Metropolitan Statistical Area | 9,146 | 412.77 |
| 25 | 48620 | Wichita, KS Metropolitan Statistical Area | 2,580 | 404.77 |
| 26 | 41740 | San Diego-Carlsbad, CA Metropolitan Statistical Area | 12,868 | 400.72 |
| 27 | 29820 | Las Vegas-Henderson-Paradise, NV Metropolitan Statistical Area | 7,986 | 393.81 |
| 28 | 36540 | Omaha-Council Bluffs, NE-IA Metropolitan Statistical Area | 3,505 | 391.55 |
| 29 | 31080 | Los Angeles-Long Beach-Anaheim, CA Metropolitan Statistical Area | 50,758 | 386.54 |
| 30 | 30780 | Little Rock-North Little Rock-Conway, AR Metropolitan Statistical Area | 2,777 | 383.36 |
| 31 | 17980 | Columbus, GA-AL Metropolitan Statistical Area | 1,197 | 378.13 |
| 32 | 28140 | Kansas City, MO-KS Metropolitan Statistical Area | 7,666 | 373.14 |
| 33 | 26300 | Hot Springs, AR Metropolitan Statistical Area | 360 | 370.47 |
| 34 | 31420 | Macon, GA Metropolitan Statistical Area | 854 | 369.28 |
| 35 | 26420 | Houston-The Woodlands-Sugar Land, TX Metropolitan Statistical Area | 23,041 | 364.97 |
| 36 | 44180 | Springfield, MO Metropolitan Statistical Area | 1,631 | 363.46 |
| 37 | 26900 | Indianapolis-Carmel-Anderson, IN Metropolitan Statistical Area | 7,078 | 362.24 |
| 38 | 13740 | Billings, MT Metropolitan Statistical Area | 588 | 355.59 |
| 39 | 17900 | Columbia, SC Metropolitan Statistical Area | 2,820 | 355.26 |
| 40 | 46140 | Tulsa, OK Metropolitan Statistical Area | 3,397 | 353.28 |
| 41 | 45820 | Topeka, KS Metropolitan Statistical Area | 825 | 352.26 |
| 42 | 11100 | Amarillo, TX Metropolitan Statistical Area | 892 | 345.47 |
| 43 | 42100 | Santa Cruz-Watsonville, CA Metropolitan Statistical Area | 872 | 323.66 |
| 44 | 31460 | Madera, CA Metropolitan Statistical Area | 492 | 322.86 |
| 45 | 41700 | San Antonio-New Braunfels, TX Metropolitan Statistical Area | 7,251 | 318.37 |
| 46 | 39380 | Pueblo, CO Metropolitan Statistical Area | 511 | 316.50 |
| 47 | 24860 | Greenville-Anderson-Mauldin, SC Metropolitan Statistical Area | 2,693 | 316.46 |
| 48 | 12060 | Atlanta-Sandy Springs-Roswell, GA Metropolitan Statistical Area | 17,444 | 315.85 |
| 49 | 22180 | Fayetteville, NC Metropolitan Statistical Area | 1,167 | 309.39 |
| 50 | 19740 | Denver-Aurora-Lakewood, CO Metropolitan Statistical Area | 8,327 | 308.70 |
| 51 | 35380 | New Orleans-Metairie, LA Metropolitan Statistical Area | 3,763 | 303.23 |
| 52 | 17460 | Cleveland-Elyria, OH Metropolitan Statistical Area | 6,202 | 300.38 |
| 53 | 27900 | Joplin, MO Metropolitan Statistical Area | 524 | 299.01 |
| 54 | 38900 | Portland-Vancouver-Hillsboro, OR-WA Metropolitan Statistical Area | 6,916 | 298.80 |
| 55 | 27140 | Jackson, MS Metropolitan Statistical Area | 1,716 | 297.72 |
| 56 | 31180 | Lubbock, TX Metropolitan Statistical Area | 888 | 294.98 |
| 57 | 25260 | Hanford-Corcoran, CA Metropolitan Statistical Area | 444 | 294.12 |
| 58 | 16860 | Chattanooga, TN-GA Metropolitan Statistical Area | 1,592 | 293.87 |
| 59 | 33340 | Milwaukee-Waukesha-West Allis, WI Metropolitan Statistical Area | 4,608 | 293.57 |
| 60 | 17820 | Colorado Springs, CO Metropolitan Statistical Area | 1,972 | 290.72 |
| 61 | 38220 | Pine Bluff, AR Metropolitan Statistical Area | 276 | 288.06 |
| 62 | 20940 | El Centro, CA Metropolitan Statistical Area | 507 | 287.12 |
| 63 | 33660 | Mobile, AL Metropolitan Statistical Area | 1,181 | 285.21 |
| 64 | 34820 | Myrtle Beach-Conway-North Myrtle Beach, SC-NC Metropolitan Statistical Area | 1,150 | 283.98 |
| 65 | 33100 | Miami-Fort Lauderdale-West Palm Beach, FL Metropolitan Statistical Area | 16,366 | 280.81 |
| 66 | 34580 | Mount Vernon-Anacortes, WA Metropolitan Statistical Area | 331 | 278.53 |
| 67 | 21660 | Eugene, OR Metropolitan Statistical Area | 990 | 277.92 |
| 68 | 46060 | Tucson, AZ Metropolitan Statistical Area | 2,740 | 274.95 |
| 69 | 46520 | Honolulu (Urban), HI Metropolitan Statistical Area | 2,698 | 274.35 |
| 70 | 19100 | Dallas-Fort Worth-Arlington, TX Metropolitan Statistical Area | 18,568 | 272.62 |
| 71 | 33860 | Montgomery, AL Metropolitan Statistical Area | 1,017 | 272.28 |
| 72 | 31020 | Longview, WA Metropolitan Statistical Area | 277 | 271.94 |
| 73 | 45500 | Texarkana, TX-AR Metropolitan Statistical Area | 405 | 270.69 |
| 74 | 12260 | Augusta-Richmond County, GA-SC Metropolitan Statistical Area | 1,566 | 269.87 |
| 75 | 16700 | Charleston-North Charleston, SC Metropolitan Statistical Area | 1,920 | 269.58 |
| 76 | 35300 | New Haven-Milford, CT Metropolitan Statistical Area | 2,302 | 266.96 |
| 77 | 41420 | Salem, OR Metropolitan Statistical Area | 1,066 | 266.23 |
| 78 | 22500 | Florence, SC Metropolitan Statistical Area | 544 | 263.74 |
| 79 | 39900 | Reno, NV Metropolitan Statistical Area | 1,154 | 263.67 |
| 80 | 16620 | Charleston, WV Metropolitan Statistical Area | 583 | 259.41 |
| 81 | 13820 | Birmingham-Hoover, AL Metropolitan Statistical Area | 2,930 | 256.95 |
| 82 | 16980 | Chicago-Naperville-Elgin, IL-IN-WI Metropolitan Statistical Area | 24,398 | 255.82 |
| 83 | 38060 | Phoenix-Mesa-Scottsdale, AZ Metropolitan Statistical Area | 11,225 | 255.19 |
| 84 | 42340 | Savannah, GA Metropolitan Statistical Area | 905 | 247.24 |
| 85 | 42200 | Santa Maria-Santa Barbara, CA Metropolitan Statistical Area | 1,071 | 245.81 |
| 86 | 11260 | Anchorage, AK Metropolitan Statistical Area | 971 | 245.11 |
| 87 | 29340 | Lake Charles, LA Metropolitan Statistical Area | 492 | 243.52 |
| 88 | 32820 | Memphis, TN-MS-AR Metropolitan Statistical Area | 3,259 | 242.89 |
| 89 | 41140 | St. Joseph, MO-KS Metropolitan Statistical Area | 310 | 242.63 |
| 90 | 32580 | McAllen-Edinburg-Mission, TX Metropolitan Statistical Area | 1,977 | 242.28 |
| 91 | 25220 | Hammond, LA Metropolitan Statistical Area | 301 | 240.01 |
| 92 | 37860 | Pensacola-Ferry Pass-Brent, FL Metropolitan Statistical Area | 1,104 | 236.45 |
| 93 | 41180 | St. Louis, MO-IL Metropolitan Statistical Area | 6,583 | 235.02 |
| 94 | 30980 | Longview, TX Metropolitan Statistical Area | 507 | 234.15 |
| 95 | 12580 | Baltimore-Columbia-Towson, MD Metropolitan Statistical Area | 6,389 | 230.59 |
| 96 | 29700 | Laredo, TX Metropolitan Statistical Area | 605 | 230.48 |
| 97 | 29420 | Lake Havasu City-Kingman, AZ Metropolitan Statistical Area | 465 | 229.03 |
| 98 | 48900 | Wilmington, NC Metropolitan Statistical Area | 615 | 228.96 |
| 99 | 49740 | Yuma, AZ Metropolitan Statistical Area | 452 | 224.65 |
| 100 | 21140 | Elkhart-Goshen, IN Metropolitan Statistical Area | 449 | 223.87 |
| 101 | 18020 | Columbus, IN Metropolitan Statistical Area | 177 | 222.40 |
| 102 | 10540 | Albany, OR Metropolitan Statistical Area | 263 | 221.45 |
| 103 | 48660 | Wichita Falls, TX Metropolitan Statistical Area | 332 | 219.58 |
| 104 | 44940 | Sumter, SC Metropolitan Statistical Area | 236 | 218.27 |
| 105 | 45780 | Toledo, OH Metropolitan Statistical Area | 1,320 | 217.05 |
| 106 | 10780 | Alexandria, LA Metropolitan Statistical Area | 335 | 216.47 |
| 107 | 18580 | Corpus Christi, TX Metropolitan Statistical Area | 957 | 216.22 |
| 108 | 45940 | Trenton, NJ Metropolitan Statistical Area | 798 | 215.43 |
| 109 | 37100 | Oxnard-Thousand Oaks-Ventura, CA Metropolitan Statistical Area | 1,800 | 214.38 |
| 110 | 13140 | Beaumont-Port Arthur, TX Metropolitan Statistical Area | 866 | 213.89 |
| 111 | 43900 | Spartanburg, SC Metropolitan Statistical Area | 666 | 208.78 |
| 112 | 19380 | Dayton, OH Metropolitan Statistical Area | 1,650 | 205.61 |
| 113 | 36740 | Orlando-Kissimmee-Sanford, FL Metropolitan Statistical Area | 4,583 | 202.09 |
| 114 | 18140 | Columbus, OH Metropolitan Statistical Area | 3,950 | 200.81 |
| 115 | 11500 | Anniston-Oxford-Jacksonville, AL Metropolitan Statistical Area | 232 | 198.74 |
| 116 | 36500 | Olympia-Tumwater, WA Metropolitan Statistical Area | 521 | 198.56 |
| 117 | 31140 | Louisville/Jefferson County, KY-IN Metropolitan Statistical Area | 2,476 | 196.16 |
| 118 | 25060 | Gulfport-Biloxi-Pascagoula, MS Metropolitan Statistical Area | 742 | 193.98 |
| 119 | 21780 | Evansville, IN-KY Metropolitan Statistical Area | 606 | 192.82 |
| 120 | 33740 | Monroe, LA Metropolitan Statistical Area | 344 | 192.65 |
| 121 | 19660 | Deltona-Daytona Beach-Ormond Beach, FL Metropolitan Statistical Area | 1,146 | 190.76 |
| 122 | 20500 | Durham-Chapel Hill, NC Metropolitan Statistical Area | 1,014 | 189.68 |
| 123 | 34900 | Napa, CA Metropolitan Statistical Area | 266 | 189.56 |
| 124 | 22900 | Fort Smith, AR-OK Metropolitan Statistical Area | 528 | 188.59 |
| 125 | 17420 | Cleveland, TN Metropolitan Statistical Area | 223 | 188.13 |
| 126 | 14740 | Bremerton-Silverdale, WA Metropolitan Statistical Area | 477 | 187.82 |
| 127 | 44140 | Springfield, MA Metropolitan Statistical Area | 1,176 | 187.59 |
| 128 | 34100 | Morristown, TN Metropolitan Statistical Area | 216 | 187.50 |
| 129 | 21340 | El Paso, TX Metropolitan Statistical Area | 1,543 | 185.67 |
| 130 | 44220 | Springfield, OH Metropolitan Statistical Area | 251 | 184.33 |
| 131 | 33460 | Minneapolis-St. Paul-Bloomington, MN-WI Metropolitan Statistical Area | 6,364 | 183.98 |
| 132 | 19780 | Des Moines-West Des Moines, IA Metropolitan Statistical Area | 1,097 | 182.90 |
| 133 | 33260 | Midland, TX Metropolitan Statistical Area | 285 | 181.78 |
| 134 | 12420 | Austin-Round Rock, TX Metropolitan Statistical Area | 3,417 | 181.46 |
| 135 | 43300 | Sherman-Denison, TX Metropolitan Statistical Area | 222 | 181.44 |
| 136 | 15180 | Brownsville-Harlingen, TX Metropolitan Statistical Area | 752 | 180.22 |
| 137 | 39300 | Providence-Warwick, RI-MA Metropolitan Statistical Area | 2,883 | 179.71 |
| 138 | 37980 | Philadelphia-Camden-Wilmington, PA-NJ-DE-MD Metropolitan Statistical Area | 10,821 | 179.31 |
| 139 | 43340 | Shreveport-Bossier City, LA Metropolitan Statistical Area | 798 | 178.74 |
| 140 | 40660 | Rome, GA Metropolitan Statistical Area | 171 | 178.46 |
| 141 | 37460 | Panama City, FL Metropolitan Statistical Area | 339 | 177.66 |
| 142 | 23580 | Gainesville, GA Metropolitan Statistical Area | 333 | 177.37 |
| 143 | 45460 | Terre Haute, IN Metropolitan Statistical Area | 305 | 177.12 |
| 144 | 42700 | Sebring, FL Metropolitan Statistical Area | 172 | 176.20 |
| 145 | 47900 | Washington-Arlington-Alexandria, DC-VA-MD-WV Metropolitan Statistical Area | 10,468 | 175.94 |
| 146 | 47380 | Waco, TX Metropolitan Statistical Area | 452 | 174.53 |
| 147 | 24660 | Greensboro-High Point, NC Metropolitan Statistical Area | 1,280 | 172.72 |
| 148 | 19140 | Dalton, GA Metropolitan Statistical Area | 245 | 172.28 |
| 149 | 28940 | Knoxville, TN Metropolitan Statistical Area | 1,469 | 172.27 |
| 150 | 23460 | Gadsden, AL Metropolitan Statistical Area | 179 | 172.23 |
| 151 | 25860 | Hickory-Lenoir-Morganton, NC Metropolitan Statistical Area | 621 | 170.81 |
| 152 | 46340 | Tyler, TX Metropolitan Statistical Area | 369 | 170.77 |
| 153 | 22420 | Flint, MI Metropolitan Statistical Area | 707 | 170.21 |
| 154 | 45220 | Tallahassee, FL Metropolitan Statistical Area | 635 | 170.12 |
| 155 | 27260 | Jacksonville, FL Metropolitan Statistical Area | 2,370 | 169.94 |
| 156 | 12940 | Baton Rouge, LA Metropolitan Statistical Area | 1,390 | 169.48 |
| 157 | 30020 | Lawton, OK Metropolitan Statistical Area | 221 | 168.59 |
| 158 | 43780 | South Bend-Mishawaka, IN-MI Metropolitan Statistical Area | 536 | 168.23 |
| 159 | 45300 | Tampa-St. Petersburg-Clearwater, FL Metropolitan Statistical Area | 4,828 | 168.19 |
| 160 | 17660 | Coeur d’Alene, ID Metropolitan Statistical Area | 240 | 166.36 |
| 161 | 11700 | Asheville, NC Metropolitan Statistical Area | 726 | 165.88 |
| 162 | 29460 | Lakeland-Winter Haven, FL Metropolitan Statistical Area | 1,029 | 165.17 |
| 163 | 47020 | Victoria, TX Metropolitan Statistical Area | 160 | 164.11 |
| 164 | 33140 | Michigan City-La Porte, IN Metropolitan Statistical Area | 181 | 162.65 |
| 165 | 41060 | St. Cloud, MN Metropolitan Statistical Area | 311 | 162.57 |
| 166 | 15940 | Canton-Massillon, OH Metropolitan Statistical Area | 656 | 162.49 |
| 167 | 29740 | Las Cruces, NM Metropolitan Statistical Area | 343 | 160.69 |
| 168 | 26620 | Huntsville, AL Metropolitan Statistical Area | 693 | 159.04 |
| 169 | 10180 | Abilene, TX Metropolitan Statistical Area | 266 | 158.81 |
| 170 | 30460 | Lexington-Fayette, KY Metropolitan Statistical Area | 776 | 158.55 |
| 171 | 21820 | Fairbanks, AK Metropolitan Statistical Area | 159 | 158.31 |
| 172 | 24140 | Goldsboro, NC Metropolitan Statistical Area | 195 | 156.52 |
| 173 | 16740 | Charlotte-Concord-Gastonia, NC-SC Metropolitan Statistical Area | 3,650 | 156.29 |
| 174 | 42220 | Santa Rosa, CA Metropolitan Statistical Area | 760 | 153.53 |
| 175 | 40060 | Richmond, VA Metropolitan Statistical Area | 1,906 | 153.00 |
| 176 | 17140 | Cincinnati, OH-KY-IN Metropolitan Statistical Area | 3,263 | 152.66 |
| 177 | 46220 | Tuscaloosa, AL Metropolitan Statistical Area | 359 | 152.36 |
| 178 | 27340 | Jacksonville, NC Metropolitan Statistical Area | 281 | 151.71 |
| 179 | 16300 | Cedar Rapids, IA Metropolitan Statistical Area | 397 | 151.28 |
| 180 | 49660 | Youngstown-Warren-Boardman, OH-PA Metropolitan Statistical Area | 831 | 149.59 |
| 181 | 38540 | Pocatello, ID Metropolitan Statistical Area | 123 | 147.75 |
| 182 | 32780 | Medford, OR Metropolitan Statistical Area | 307 | 147.21 |
| 183 | 41660 | San Angelo, TX Metropolitan Statistical Area | 171 | 146.70 |
| 184 | 20260 | Duluth, MN-WI Metropolitan Statistical Area | 410 | 146.49 |
| 185 | 27180 | Jackson, TN Metropolitan Statistical Area | 191 | 146.20 |
| 186 | 37620 | Parkersburg-Vienna, WV Metropolitan Statistical Area | 135 | 145.99 |
| 187 | 10500 | Albany, GA Metropolitan Statistical Area | 227 | 145.80 |
| 188 | 47260 | Virginia Beach-Norfolk-Newport News, VA-NC Metropolitan Statistical Area | 2,488 | 145.72 |
| 189 | 40580 | Rocky Mount, NC Metropolitan Statistical Area | 217 | 144.03 |
| 190 | 40420 | Rockford, IL Metropolitan Statistical Area | 495 | 143.64 |
| 191 | 24260 | Grand Island, NE Metropolitan Statistical Area | 120 | 142.88 |
| 192 | 43580 | Sioux City, IA-NE-SD Metropolitan Statistical Area | 239 | 141.66 |
| 193 | 29020 | Kokomo, IN Metropolitan Statistical Area | 117 | 141.37 |
| 194 | 14860 | Bridgeport-Stamford-Norwalk, CT Metropolitan Statistical Area | 1,328 | 141.29 |
| 195 | 42140 | Santa Fe, NM Metropolitan Statistical Area | 208 | 141.09 |
| 196 | 28420 | Kennewick-Richland, WA Metropolitan Statistical Area | 382 | 140.89 |
| 197 | 23060 | Fort Wayne, IN Metropolitan Statistical Area | 597 | 140.76 |
| 198 | 47460 | Walla Walla, WA Metropolitan Statistical Area | 89 | 140.02 |
| 199 | 47220 | Vineland-Bridgeton, NJ Metropolitan Statistical Area | 220 | 139.83 |
| 200 | 27860 | Jonesboro, AR Metropolitan Statistical Area | 175 | 139.29 |
| 201 | 28660 | Killeen-Temple, TX Metropolitan Statistical Area | 585 | 138.21 |
| 202 | 29940 | Lawrence, KS Metropolitan Statistical Area | 158 | 138.21 |
| 203 | 25940 | Hilton Head Island-Bluffton-Beaufort, SC Metropolitan Statistical Area | 274 | 138.06 |
| 204 | 15260 | Brunswick, GA Metropolitan Statistical Area | 157 | 137.95 |
| 205 | 19460 | Decatur, AL Metropolitan Statistical Area | 210 | 136.92 |
| 206 | 14020 | Bloomington, IN Metropolitan Statistical Area | 223 | 136.74 |
| 207 | 22520 | Florence-Muscle Shoals, AL Metropolitan Statistical Area | 201 | 136.44 |
| 208 | 33780 | Monroe, MI Metropolitan Statistical Area | 205 | 136.32 |
| 209 | 15500 | Burlington, NC Metropolitan Statistical Area | 210 | 136.03 |
| 210 | 12020 | Athens-Clarke County, GA Metropolitan Statistical Area | 269 | 135.92 |
| 211 | 34980 | Nashville-Davidson–Murfreesboro–Franklin, TN Metropolitan Statistical Area | 2,381 | 135.44 |
| 212 | 23540 | Gainesville, FL Metropolitan Statistical Area | 366 | 135.36 |
| 213 | 25540 | Hartford-West Hartford-East Hartford, CT Metropolitan Statistical Area | 1,644 | 135.29 |
| 214 | 24540 | Greeley, CO Metropolitan Statistical Area | 364 | 134.92 |
| 215 | 29200 | Lafayette-West Lafayette, IN Metropolitan Statistical Area | 281 | 134.43 |
| 216 | 20100 | Dover, DE Metropolitan Statistical Area | 227 | 133.99 |
| 217 | 15980 | Cape Coral-Fort Myers, FL Metropolitan Statistical Area | 884 | 133.71 |
| 218 | 47580 | Warner Robins, GA Metropolitan Statistical Area | 248 | 133.18 |
| 219 | 17860 | Columbia, MO Metropolitan Statistical Area | 227 | 132.92 |
| 220 | 34620 | Muncie, IN Metropolitan Statistical Area | 156 | 132.78 |
| 221 | 42020 | San Luis Obispo-Paso Robles-Arroyo Grande, CA Metropolitan Statistical Area | 367 | 132.76 |
| 222 | 25980 | Hinesville, GA Metropolitan Statistical Area | 107 | 132.49 |
| 223 | 26380 | Houma-Thibodaux, LA Metropolitan Statistical Area | 278 | 132.45 |
| 224 | 24500 | Great Falls, MT Metropolitan Statistical Area | 109 | 132.31 |
| 225 | 30300 | Lewiston, ID-WA Metropolitan Statistical Area | 82 | 132.20 |
| 226 | 22140 | Farmington, NM Metropolitan Statistical Area | 167 | 132.01 |
| 227 | 24300 | Grand Junction, CO Metropolitan Statistical Area | 194 | 131.48 |
| 228 | 31900 | Mansfield, OH Metropolitan Statistical Area | 160 | 131.39 |
| 229 | 10420 | Akron, OH Metropolitan Statistical Area | 910 | 128.95 |
| 230 | 33540 | Missoula, MT Metropolitan Statistical Area | 143 | 127.90 |
| 231 | 49180 | Winston-Salem, NC Metropolitan Statistical Area | 831 | 127.69 |
| 232 | 48300 | Wenatchee, WA Metropolitan Statistical Area | 143 | 126.06 |
| 233 | 29620 | Lansing-East Lansing, MI Metropolitan Statistical Area | 589 | 126.04 |
| 234 | 16180 | Carson City, NV Metropolitan Statistical Area | 68 | 125.74 |
| 235 | 14460 | Boston-Cambridge-Newton, MA-NH Metropolitan Statistical Area | 5,858 | 125.06 |
| 236 | 44100 | Springfield, IL Metropolitan Statistical Area | 264 | 124.67 |
| 237 | 13380 | Bellingham, WA Metropolitan Statistical Area | 257 | 124.54 |
| 238 | 39580 | Raleigh, NC Metropolitan Statistical Area | 1,509 | 124.25 |
| 239 | 39660 | Rapid City, SD Metropolitan Statistical Area | 175 | 123.74 |
| 240 | 29180 | Lafayette, LA Metropolitan Statistical Area | 588 | 122.73 |
| 241 | 37340 | Palm Bay-Melbourne-Titusville, FL Metropolitan Statistical Area | 673 | 122.18 |
| 242 | 35620 | New York-Newark-Jersey City, NY-NJ-PA Metropolitan Statistical Area | 24,316 | 121.89 |
| 243 | 36100 | Ocala, FL Metropolitan Statistical Area | 407 | 120.64 |
| 244 | 17780 | College Station-Bryan, TX Metropolitan Statistical Area | 282 | 119.08 |
| 245 | 16940 | Cheyenne, WY Metropolitan Statistical Area | 114 | 118.99 |
| 246 | 35840 | North Port-Sarasota-Bradenton, FL Metropolitan Statistical Area | 867 | 118.36 |
| 247 | 31740 | Manhattan, KS Metropolitan Statistical Area | 116 | 118.26 |
| 248 | 24780 | Greenville, NC Metropolitan Statistical Area | 206 | 118.21 |
| 249 | 26820 | Idaho Falls, ID Metropolitan Statistical Area | 162 | 118.19 |
| 250 | 16020 | Cape Girardeau, MO-IL Metropolitan Statistical Area | 113 | 115.97 |
| 251 | 17300 | Clarksville, TN-KY Metropolitan Statistical Area | 316 | 115.93 |
| 252 | 22220 | Fayetteville-Springdale-Rogers, AR-MO Metropolitan Statistical Area | 568 | 115.46 |
| 253 | 12220 | Auburn-Opelika, AL Metropolitan Statistical Area | 173 | 114.62 |
| 254 | 43620 | Sioux Falls, SD Metropolitan Statistical Area | 279 | 114.57 |
| 255 | 27620 | Jefferson City, MO Metropolitan Statistical Area | 171 | 113.63 |
| 256 | 15380 | Buffalo-Cheektowaga-Niagara Falls, NY Metropolitan Statistical Area | 1,286 | 113.39 |
| 257 | 12100 | Atlantic City-Hammonton, NJ Metropolitan Statistical Area | 308 | 111.65 |
| 258 | 25180 | Hagerstown-Martinsburg, MD-WV Metropolitan Statistical Area | 286 | 110.73 |
| 259 | 39740 | Reading, PA Metropolitan Statistical Area | 452 | 109.31 |
| 260 | 19340 | Davenport-Moline-Rock Island, IA-IL Metropolitan Statistical Area | 418 | 108.94 |
| 261 | 22020 | Fargo, ND-MN Metropolitan Statistical Area | 242 | 108.28 |
| 262 | 26580 | Huntington-Ashland, WV-KY-OH Metropolitan Statistical Area | 392 | 107.66 |
| 263 | 25620 | Hattiesburg, MS Metropolitan Statistical Area | 158 | 106.76 |
| 264 | 20020 | Dothan, AL Metropolitan Statistical Area | 157 | 106.30 |
| 265 | 27740 | Johnson City, TN Metropolitan Statistical Area | 210 | 104.50 |
| 266 | 19300 | Daphne-Fairhope-Foley, AL Metropolitan Statistical Area | 203 | 103.82 |
| 267 | 30620 | Lima, OH Metropolitan Statistical Area | 109 | 103.52 |
| 268 | 27100 | Jackson, MI Metropolitan Statistical Area | 166 | 103.51 |
| 269 | 13900 | Bismarck, ND Metropolitan Statistical Area | 128 | 103.43 |
| 270 | 26140 | Homosassa Springs, FL Metropolitan Statistical Area | 141 | 101.24 |
| 271 | 36260 | Ogden-Clearfield, UT Metropolitan Statistical Area | 627 | 100.87 |
| 272 | 28700 | Kingsport-Bristol-Bristol, TN-VA Metropolitan Statistical Area | 310 | 100.56 |
| 273 | 14540 | Bowling Green, KY Metropolitan Statistical Area | 164 | 100.28 |
| 274 | 24220 | Grand Forks, ND-MN Metropolitan Statistical Area | 101 | 100.25 |
| 275 | 43420 | Sierra Vista-Douglas, AZ Metropolitan Statistical Area | 127 | 98.09 |
| 276 | 45540 | The Villages, FL Metropolitan Statistical Area | 105 | 98.08 |
| 277 | 28020 | Kalamazoo-Portage, MI Metropolitan Statistical Area | 321 | 96.63 |
| 278 | 46660 | Valdosta, GA Metropolitan Statistical Area | 138 | 96.57 |
| 279 | 13460 | Bend-Redmond, OR Metropolitan Statistical Area | 158 | 95.21 |
| 280 | 38940 | Port St. Lucie, FL Metropolitan Statistical Area | 417 | 95.18 |
| 281 | 40980 | Saginaw, MI Metropolitan Statistical Area | 185 | 94.13 |
| 282 | 40220 | Roanoke, VA Metropolitan Statistical Area | 293 | 93.96 |
| 283 | 34740 | Muskegon, MI Metropolitan Statistical Area | 159 | 92.98 |
| 284 | 30700 | Lincoln, NE Metropolitan Statistical Area | 289 | 92.00 |
| 285 | 14500 | Boulder, CO Metropolitan Statistical Area | 283 | 91.28 |
| 286 | 10900 | Allentown-Bethlehem-Easton, PA-NJ Metropolitan Statistical Area | 745 | 90.08 |
| 287 | 42540 | Scranton–Wilkes-Barre–Hazleton, PA Metropolitan Statistical Area | 504 | 89.67 |
| 288 | 11460 | Ann Arbor, MI Metropolitan Statistical Area | 316 | 89.21 |
| 289 | 12980 | Battle Creek, MI Metropolitan Statistical Area | 120 | 88.88 |
| 290 | 15680 | California-Lexington Park, MD Metropolitan Statistical Area | 97 | 88.48 |
| 291 | 45060 | Syracuse, NY Metropolitan Statistical Area | 584 | 88.23 |
| 292 | 34060 | Morgantown, WV Metropolitan Statistical Area | 120 | 88.15 |
| 293 | 42680 | Sebastian-Vero Beach, FL Metropolitan Statistical Area | 125 | 88.03 |
| 294 | 35660 | Niles-Benton Harbor, MI Metropolitan Statistical Area | 136 | 87.60 |
| 295 | 13220 | Beckley, WV Metropolitan Statistical Area | 109 | 87.60 |
| 296 | 36140 | Ocean City, NJ Metropolitan Statistical Area | 84 | 87.59 |
| 297 | 31860 | Mankato-North Mankato, MN Metropolitan Statistical Area | 85 | 86.24 |
| 298 | 47940 | Waterloo-Cedar Falls, IA Metropolitan Statistical Area | 146 | 86.14 |
| 299 | 19180 | Danville, IL Metropolitan Statistical Area | 69 | 85.90 |
| 300 | 19500 | Decatur, IL Metropolitan Statistical Area | 93 | 85.10 |
| 301 | 36980 | Owensboro, KY Metropolitan Statistical Area | 99 | 85.05 |
| 302 | 37900 | Peoria, IL Metropolitan Statistical Area | 323 | 84.53 |
| 303 | 34940 | Naples-Immokalee-Marco Island, FL Metropolitan Statistical Area | 287 | 84.50 |
| 304 | 48540 | Wheeling, WV-OH Metropolitan Statistical Area | 123 | 84.39 |
| 305 | 39540 | Racine, WI Metropolitan Statistical Area | 164 | 84.08 |
| 306 | 25420 | Harrisburg-Carlisle, PA Metropolitan Statistical Area | 457 | 81.94 |
| 307 | 39140 | Prescott, AZ Metropolitan Statistical Area | 176 | 81.81 |
| 308 | 18880 | Crestview-Fort Walton Beach-Destin, FL Metropolitan Statistical Area | 207 | 81.62 |
| 309 | 16220 | Casper, WY Metropolitan Statistical Area | 66 | 81.51 |
| 310 | 38300 | Pittsburgh, PA Metropolitan Statistical Area | 1,918 | 81.24 |
| 311 | 40380 | Rochester, NY Metropolitan Statistical Area | 872 | 80.50 |
| 312 | 22380 | Flagstaff, AZ Metropolitan Statistical Area | 108 | 79.10 |
| 313 | 39460 | Punta Gorda, FL Metropolitan Statistical Area | 128 | 77.70 |
| 314 | 26980 | Iowa City, IA Metropolitan Statistical Area | 125 | 77.56 |
| 315 | 14260 | Boise City, ID Metropolitan Statistical Area | 495 | 76.12 |
| 316 | 49340 | Worcester, MA-CT Metropolitan Statistical Area | 701 | 75.64 |
| 317 | 35980 | Norwich-New London, CT Metropolitan Statistical Area | 207 | 75.51 |
| 318 | 41100 | St. George, UT Metropolitan Statistical Area | 111 | 75.10 |
| 319 | 40340 | Rochester, MN Metropolitan Statistical Area | 159 | 75.05 |
| 320 | 31540 | Madison, WI Metropolitan Statistical Area | 459 | 73.16 |
| 321 | 22660 | Fort Collins, CO Metropolitan Statistical Area | 231 | 73.10 |
| 322 | 27500 | Janesville-Beloit, WI Metropolitan Statistical Area | 117 | 72.79 |
| 323 | 10580 | Albany-Schenectady-Troy, NY Metropolitan Statistical Area | 632 | 71.99 |
| 324 | 35100 | New Bern, NC Metropolitan Statistical Area | 91 | 71.28 |
| 325 | 15540 | Burlington-South Burlington, VT Metropolitan Statistical Area | 153 | 71.23 |
| 326 | 39340 | Provo-Orem, UT Metropolitan Statistical Area | 394 | 70.08 |
| 327 | 20220 | Dubuque, IA Metropolitan Statistical Area | 65 | 67.92 |
| 328 | 24580 | Green Bay, WI Metropolitan Statistical Area | 211 | 67.54 |
| 329 | 20700 | East Stroudsburg, PA Metropolitan Statistical Area | 112 | 67.01 |
| 330 | 28100 | Kankakee, IL Metropolitan Statistical Area | 75 | 66.89 |
| 331 | 16580 | Champaign-Urbana, IL Metropolitan Statistical Area | 157 | 66.76 |
| 332 | 30140 | Lebanon, PA Metropolitan Statistical Area | 90 | 66.43 |
| 333 | 49620 | York-Hanover, PA Metropolitan Statistical Area | 286 | 65.15 |
| 334 | 18700 | Corvallis, OR Metropolitan Statistical Area | 56 | 64.67 |
| 335 | 13020 | Bay City, MI Metropolitan Statistical Area | 69 | 64.59 |
| 336 | 11180 | Ames, IA Metropolitan Statistical Area | 59 | 63.85 |
| 337 | 31700 | Manchester-Nashua, NH Metropolitan Statistical Area | 257 | 63.62 |
| 338 | 20740 | Eau Claire, WI Metropolitan Statistical Area | 99 | 60.16 |
| 339 | 21060 | Elizabethtown-Fort Knox, KY Metropolitan Statistical Area | 90 | 59.42 |
| 340 | 29100 | La Crosse-Onalaska, WI-MN Metropolitan Statistical Area | 79 | 58.30 |
| 341 | 24340 | Grand Rapids-Wyoming, MI Metropolitan Statistical Area | 592 | 58.23 |
| 342 | 29540 | Lancaster, PA Metropolitan Statistical Area | 306 | 57.78 |
| 343 | 38340 | Pittsfield, MA Metropolitan Statistical Area | 74 | 57.11 |
| 344 | 12700 | Barnstable Town, MA Metropolitan Statistical Area | 121 | 56.28 |
| 345 | 14100 | Bloomsburg-Berwick, PA Metropolitan Statistical Area | 48 | 56.25 |
| 346 | 38860 | Portland-South Portland, ME Metropolitan Statistical Area | 292 | 56.16 |
| 347 | 12620 | Bangor, ME Metropolitan Statistical Area | 86 | 56.08 |
| 348 | 30340 | Lewiston-Auburn, ME Metropolitan Statistical Area | 60 | 55.76 |
| 349 | 21500 | Erie, PA Metropolitan Statistical Area | 152 | 54.23 |
| 350 | 16060 | Carbondale-Marion, IL Metropolitan Statistical Area | 66 | 52.08 |
| 351 | 22540 | Fond du Lac, WI Metropolitan Statistical Area | 53 | 52.06 |
| 352 | 48060 | Watertown-Fort Drum, NY Metropolitan Statistical Area | 62 | 51.88 |
| 353 | 23900 | Gettysburg, PA Metropolitan Statistical Area | 51 | 50.22 |
| 354 | 19060 | Cumberland, MD-WV Metropolitan Statistical Area | 50 | 49.39 |
| 355 | 49020 | Winchester, VA-WV Metropolitan Statistical Area | 65 | 49.25 |
| 356 | 14010 | Bloomington, IL Metropolitan Statistical Area | 94 | 49.20 |
| 357 | 27780 | Johnstown, PA Metropolitan Statistical Area | 69 | 49.11 |
| 358 | 16540 | Chambersburg-Waynesboro, PA Metropolitan Statistical Area | 73 | 48.00 |
| 359 | 48260 | Weirton-Steubenville, WV-OH Metropolitan Statistical Area | 58 | 47.54 |
| 360 | 11020 | Altoona, PA Metropolitan Statistical Area | 57 | 45.13 |
| 361 | 48700 | Williamsport, PA Metropolitan Statistical Area | 52 | 44.54 |
| 362 | 44420 | Staunton-Waynesboro, VA Metropolitan Statistical Area | 53 | 44.34 |
| 363 | 16820 | Charlottesville, VA Metropolitan Statistical Area | 98 | 43.74 |
| 364 | 31340 | Lynchburg, VA Metropolitan Statistical Area | 112 | 43.67 |
| 365 | 13780 | Binghamton, NY Metropolitan Statistical Area | 108 | 43.59 |
| 366 | 36780 | Oshkosh-Neenah, WI Metropolitan Statistical Area | 68 | 40.11 |
| 367 | 48140 | Wausau, WI Metropolitan Statistical Area | 53 | 39.14 |
| 368 | 46540 | Utica-Rome, NY Metropolitan Statistical Area | 115 | 38.62 |
| 369 | 13980 | Blacksburg-Christiansburg-Radford, VA Metropolitan Statistical Area | 65 | 36.04 |
| 370 | 28740 | Kingston, NY Metropolitan Statistical Area | 63 | 34.81 |
| 371 | 43100 | Sheboygan, WI Metropolitan Statistical Area | 40 | 34.81 |
| 372 | 11540 | Appleton, WI Metropolitan Statistical Area | 75 | 32.61 |
| 373 | 30860 | Logan, UT-ID Metropolitan Statistical Area | 42 | 32.37 |
| 374 | 21300 | Elmira, NY Metropolitan Statistical Area | 28 | 31.64 |
| 375 | 41540 | Salisbury, MD-DE Metropolitan Statistical Area | 119 | 30.87 |
| 376 | 27060 | Ithaca, NY Metropolitan Statistical Area | 29 | 27.99 |
| 377 | 24020 | Glens Falls, NY Metropolitan Statistical Area | 34 | 26.47 |
| 378 | 33220 | Midland, MI Metropolitan Statistical Area | 21 | 25.02 |
| 379 | 44300 | State College, PA Metropolitan Statistical Area | 35 | 22.52 |
| 380 | 25500 | Harrisonburg, VA Metropolitan Statistical Area | 27 | 20.91 |
References
Federal Bureau of Investigations. 2012. Uniform Crime Reports. Accessed September 6, 2014.
Hirsch, Jerry. June 26, 2014. California cities lead nation in per capita car theft. Los Angeles Times. Accessed September 5, 2014.
National Insurance Crime Bureau. June 2013. Hot Spots 2013. Accessed September 3, 2014.