
With the help of a supercomputer, NASA has created a model of the way carbon dioxide moves through Earth’s atmosphere. As the issue of climate change grows more and more pressing, scientists are looking at ways to curb the manmade effects of climate change in the ways they can. Gathering data is one essential way scientists and researchers are hoping will change peoples’ attitudes towards the realities of climate change.
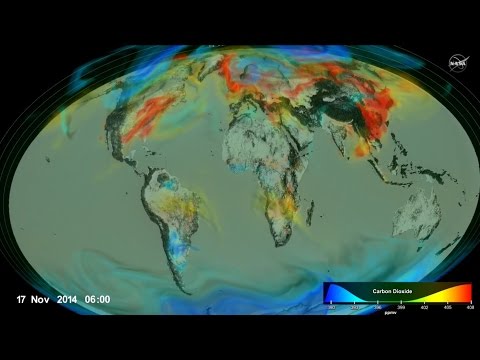
Scientists are tracking the emissions and movements of carbon dioxide in Earth’s atmosphere. Using weather and satellite data from 2014-2015, NASA has put together a highly detailed map of the movement of carbon dioxide.
Scientists can track levels of atmospheric carbon dioxide, which serves as an indication of long-term climate changes in Earth’s atmosphere. Carbon dioxide traps heat in Earth’s atmosphere, but about 50% of manmade carbon dioxide is absorbed in the oceans and by plants on the surface of the Earth.
The other half of the carbon dioxide is trapped in the atmosphere. Using the supercomputer, scientists can model what our Earth is currently doing with excess carbon dioxide, where it is being absorbed, and how the seasons affect CO2 levels.
The new map created by the supercomputer can help researchers understand better how carbon dioxide is influencing our world. Factors like the seasons, urban areas, physical geography, ocean currents, and more all affect carbon dioxide levels.
NASA compiled a massive amount of data gathered over many years with the help of different organizations concerned with climate change. The computer model hasn’t been able to create a carbon dioxide map of the entire world yet, but that is NASA’s next goal. Having the ability to take real world climate data and model it is the essential next step in understanding how mankind is exacerbating climate change, where carbon dioxide is, where it is going, and how our Earth is changing day by day.
Following Carbon Dioxide Through Earth’s Atmosphere
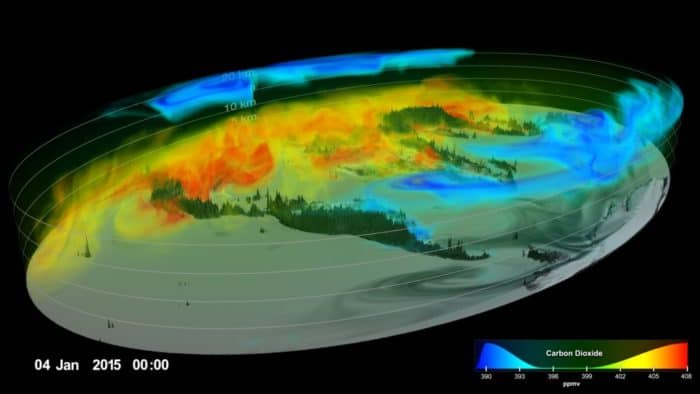
Scientists have created a model of the movement of carbon dioxide (CO2) as it moves through the Earth’s atmosphere from September 1, 2014 to August 31, 2015 based on observations from NASA’s Orbiting Carbon Observatory (OCO-2) satellite combined with a high-resolution weather model.
More:
Related
Breathing Earth is an interesting web site that simulates carbon dioxide emissions as well as birth and death rates around the world. Hover over a point on the map and get the estimated statistics for that particular country. A running tab on the lower left hand calculates for the specific country and the lower right hand tabulates for the entire world :
Please remember that this real time simulation is just that: a simulation. Although the CO2 emission, birth rate and death rate data used in Breathing Earth comes from reputable sources, data that measures things on such a massive scale can never be 100% accurate. Please note however that the CO2 emission levels shown here are much more likely to be too low than they are to be too high.