
This tutorial by Nick Williams, a MapInfo trainer at Acuity Training, provides an overview of how to create, edit, and convert features within MapInfo. Nick’s previous tutorial was on Thematic Mapping with MapInfo and Excel.
An introduction to GIS features
In GIS software such as MapInfo, a layer can only contain the features from one dataset or table. The dataset may either contain raster images or vector data, but not both. Vector data in MapInfo is comprised of points, lines and polygon features.
There is a notable difference between MapInfo and other GIS software as a MapInfo table (.tab file) can contain a mixture of object types. However, the user needs to consider if it is good data management for a data set to contain mixed feature types.
For example
- A local authority should have separate data sets for kerb lines and street furniture which are typically points.
- A utility company may wish to have to group all OS Mastermap together as a single grey background layer.
Drawing Toolbar
Features are created and edited using the Drawing Toolbar:
![]()
The buttons in the left section are used to draw new features. They are from left to right:-
- Points
- Line
- Polyline
- Arcs
- Polygon
- Ellipse
- Rectangle
- Rounded rectangle
- Text,
- Frame (Layout Space).
The buttons in the middle section are-
- Reshape polygons
- Add Nodes to polylines and polygons.
The buttons in the right section are to modify the style for:-
- Points
- Lines
- Polygons
These change the style of selected objects. See the Style section on how to change the style for an entire layer.
Creating features
To draw new features
To draw new individual features:-
- Make the layer editable using either the layer Panel or by clicking and selecting the Editing Pull Up in the status bar
- Use the buttons to the left of the Drawing Toolbar to draw new features
Additional Modes
Orthogonal Mode
You can draw orthogonal (right angle) polygon line segments when you press the Ctrl key. This restricts new segments 45 degree increments relative to the last line segment. This is useful when you want to draw perpendicular lines.
AutoTrace Mode
AutoTrace automatically traces the nodes of a new polyline or polygon over existing features. You need only specify the start and end point of the trace, rather than manually enter each node. N.B. Snap Mode must already be activated to use AutoTrace:-
To trace the nodes of an existing polyline or polygon:
- Press the S key to activate Snap Mode.
- Press the T key to activate Autotrace.
- Click on the first node of the polyline/polygon you want to trace.
- Move the mouse to another node of the same object:-
- Polyline: Hold down the Shift key or the Ctrl key and click.
- Polygon: Hold down the Shift key for the shorter trace path or the Ctrl key for the longer
- Trace path and click.
- Continue until you have traced the entire polygon/polyline and right-click to end.
Creating Points from co-ordinates ( x/y data)
A common GIS task is to map a list of points with co-ordinates that may be supplied in a data format (e.g. .xls, .csv etc.). A Comma Separated Value file contains data sets separated by commas, where each new line represents a new database row, and each database row has one or more fields separated by a comma. They can be organised into cells or columns by spreadsheet or database programs. CSV files are commonly used for transferring data between databases in a simple text-based format.
MapInfo can import most data interchange formats and then produce points from the co-ordinates.
- Press the file open button or select File, Open
- In the File Open dialogue, use the Types of File pull down to select the file type (e.g. .csv, .xls etc.)
- Ticking the “create copy in MapInfo for read/write” box allows the table to be edited; otherwise it will be display only.
- The CSV Information box, select whether the data is comma or tab delineated and whether to use the first line of the data for column headings.
- The file will now open in the Browser View. Use the menus to select Table, Maintenance, and Table Structure to check the column types. It is important that the co-ordinate columns are either integer, decimal or float format.
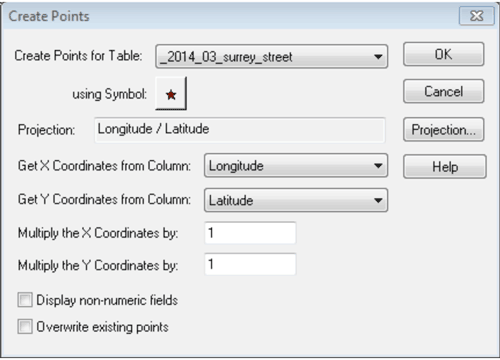
- Use the menu to select Table, Create Points. The Create Points dialogue box opens:

- In the Create Points dialogue, select the column that contain the X and Y co-ordinates (Get co-ordinates from column)
- Select the projection
- Multiply the co-ordinates by: MapInfo uses 6 figure co-ordinates for British National Grid. If the co-ordinates are in this format then leave this as 1. Co-ordinates that are in a different format may need to be multiplied by 10 (for 5 figure co-ordinates) or 0.1 (for 7 figure co-ordinates) etc.
- Overwrite Existing Points: This is useful for correcting a previous attempt to create points that resulted in an error, otherwise leave this unticked.
- Press Ok, the points are created, but they are not immediately visible. You will need to either create a new map window; or add them to the current map window.
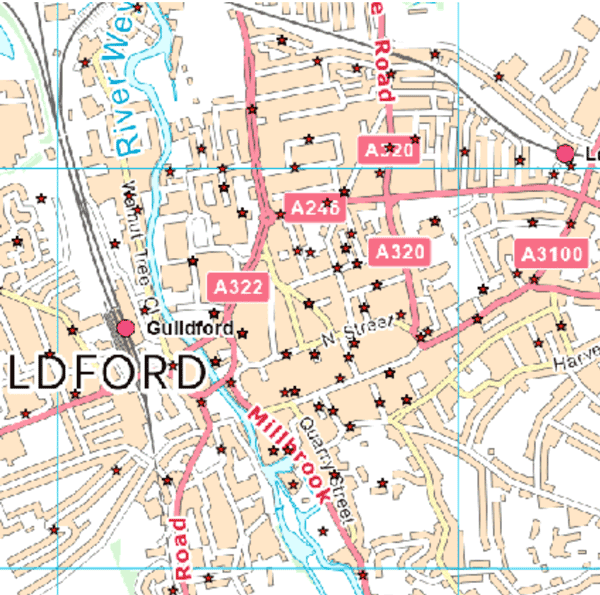
- It is a good idea to open an existing layer (e.g. a boundary, OS background etc) to check the points have been created in the correct location. Common errors include not specifying the correct projection, not multiplying or dividing the co-ordinates correctly. These result in the points being created in a significantly different area:-

Editing Features
- Make the layer editable using either the layer Panel or clicking and selecting the Editing Pull Up in the status bar
- Use the buttons in the middle section to reshape regions and polylines.
- Use the buttons to the right of the Drawing Toolbar to edit the style of the selected object.
I will demonstrate a few of the editing features:-

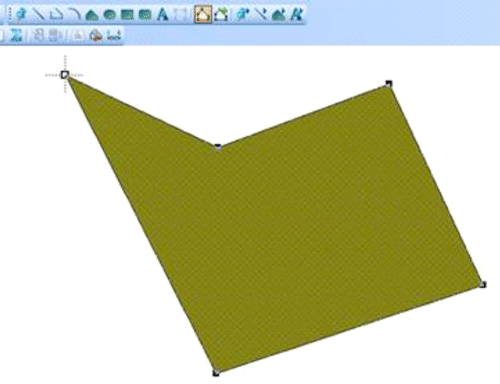
- Selecting the polygon makes the resize grips appear. Clicking and dragging these resizes the polygon, but does not change its shape.
- Pressing the Reshape button changes the grips to Reshape Mode. There is a grip on every node in the shape. Selecting and dragging a grip, moves the node it is resting on, therefore re-shaping the polygon:

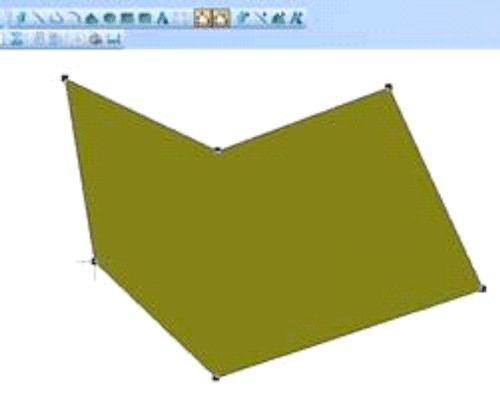
- Press the Add Node Button and then select a point on the polygon’s outline to add an extra node. This node can now be dragged to re-shape the polygon:

Converting Features
Convert between polylines and regions
To convert a polyline into a region-
- Make the object’s layer editable
- Select the object
- Right click and select Enclose
To convert a region into polylines-
- Make the object’s layer editable
- Select the object
- Right click and select Convert to Polylines
To Split Polylines
- Make the object’s layer editable
- Select a node on the object
- Right click and select Split at Node
Styles
Styles can be changed either by selecting objects and changing their style, or by applying a style over-ride to the layer. The table summarises the differences:-
| Change object Style | Apply Style Over-ride |
| Can be applied to selected objects or the entire layer | Changes the style for entire layer |
| Changes objects. Changes saved with object’s table. | “Non-destructive” to objects. Override saved with workspace. |
| Affects their appearance in all workspaces. | Changes apply to current workspace only. |
It is important to remember that MapInfo can save style information with the table. Therefore changes to an objects style may affect all users.
I generally change the object’s style when I’m certain the objects should appear in a certain style repeatedly (e.g. water distribution mains are commonly shown as blue lines).
I use style overrides when I want to quickly change a style for a particular workspace (map) only (e.g. nature reserves may have a green transparent fill in one map, but a red fill to show they are planning constraints in another map).
Change the object style
- To change the style of one object, select it and then press the Line/Point/Region Style button.
- To change the style of every object,
- Select the layer name in the Layer Control.
- Use the menus to select Query, select all from *layer name*
- Press the appropriate style button
To apply a Layer Override
- Right click the layer in the Layer Control
- Select Layer Properties to open the Lyer Properties dialogue box
- Select the Layer Display tab, tick the Style Override box, and press the style box next to it to open the Style dialog
- The styles for Lines, Points and Regions are as follows:-


Region Style
- Fill Pattern: This is the pattern used to fill a region. Select N for no fill
- Foreground: This is the foreground colour. Press the … at the bottom right of the colour swatch fly out to enter custom colours by the RGB or Hue Sat Val values.
- Background: Ticking this allows the background of dashed, dotted etc fills to be filled with a colour. If it is left unticked; the background will be transparent, which is useful when there is detail underneath the selected layer.
- The Border Style, Colour and Width change the border appearance.
- The Preview button previews the selected style on the layer.
Line Style
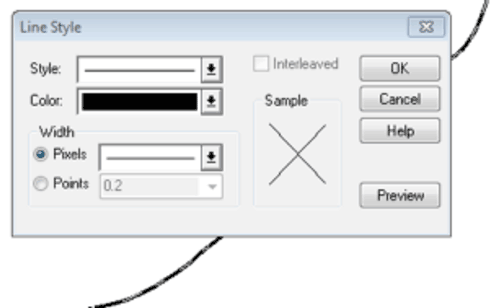
- The style selects the line style. In this case, I have chosen a dashed style for railway lines. Select N for invisible lines
- The colour is used to select the line colour. Press the … at the bottom right of the colour swatch fly out to enter custom colours by the RGB or Hue Sat Val values.
- The Interleaved box selects whether or not to enable Interleaving. Enabling it means overlapping lines are shown as merging.
Point Style

- Font: Selects the font. MapInfo contains a variety of map symbol fonts (e.g. oil and gas symbols, weather, infrastructure, transport symbols). It is possible to change the font size.
- Symbol: Selects the symbol. Choose N for no symbol. I use this when I have applied a thematic to the layer and I want to hide the original symbols.
- Colour, selects the symbol colour. Press the … at the bottom right of the colour swatch fly out to enter custom colours by the RGB or Hue Sat Val values.
- This is greyed out for MapInfo 3 compatible symbols. There are the following options for newer symbols:-:-
- Halo: Applies a coloured halo to the symbols. A white halo can give more prominence on cluttered maps
- Border: This draws a thin border around the symbols. MapInfo 3 symbols tend to have a black border by default.
- Effects: Drop Shadow and Bold can give the symbols greater prominence.
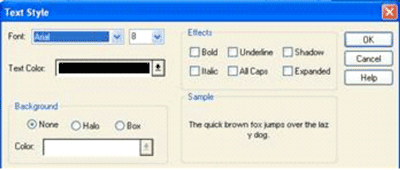
Text Style
- To change the style of individual text, select it and then press the Text Style button.
- To apply a Style Override, click the Style Override swatch next to the layer in the Layer Control Panel.
- The Text Style dialog box displays:-

- Font: Selects the font and the font size.
- Symbol: Selects the symbol. Choose N for no symbol. I use this when I have applied a thematic to the layer and I want to hide the original symbols.
- Colour, selects the symbol colour. Press the … at the bottom right of the colour swatch fly out to enter custom colours by the RGB or Hue Sat Val values.
- Background:-
- None: No background
- Halo: Applies a coloured halo to the symbols. A white halo can give more prominence on cluttered maps
- Box: Draws a box around the text
- Effects: Choose from Bold, Underlined, Italic, All Capital, Expanded text and also a Drop Shadow
Custom Symbols
It is possible to add custom symbols. They are stored in the CUSTSYMB directory and added by selecting Custom Symbols from the Change Symbol Style dialogue. The symbol needs to meet the following requirements:
- In bmp; gif; png; jpg; jp2; j2k; .pcx; psd; tif; tga; ecw format
- In 256 colour
- Under 128kb in size
To add a custom symbol:-
- Copy it to the CUSTSYMB directory (e.g. C:\Documents and Settings\USERNAME?\Application Data\MapInfo\MapInfo\Professional\VERSION NO?\CustSymb
- Follow the procedure to select Symbol Style and select Custom Symbols from the Font pull down.
Add attributes
The I button displays the information for selected objects. It is possible to enter or edit information if the table is editable.
Revert Table (Undo)
Selecting File, Revert Table acts as an Undo. It discards all changes that have been made since the table was last saved.
Acknowledgements
Ordnance Survey Open Data is used courtesy of Ordnance Survey. Crime data is used courtesy of Surrey Police Force. The mapping is for illustrational purposes and does not reflect the opinions of Acuity Training nor is it intended to give any opinion on crime levels or police performance.